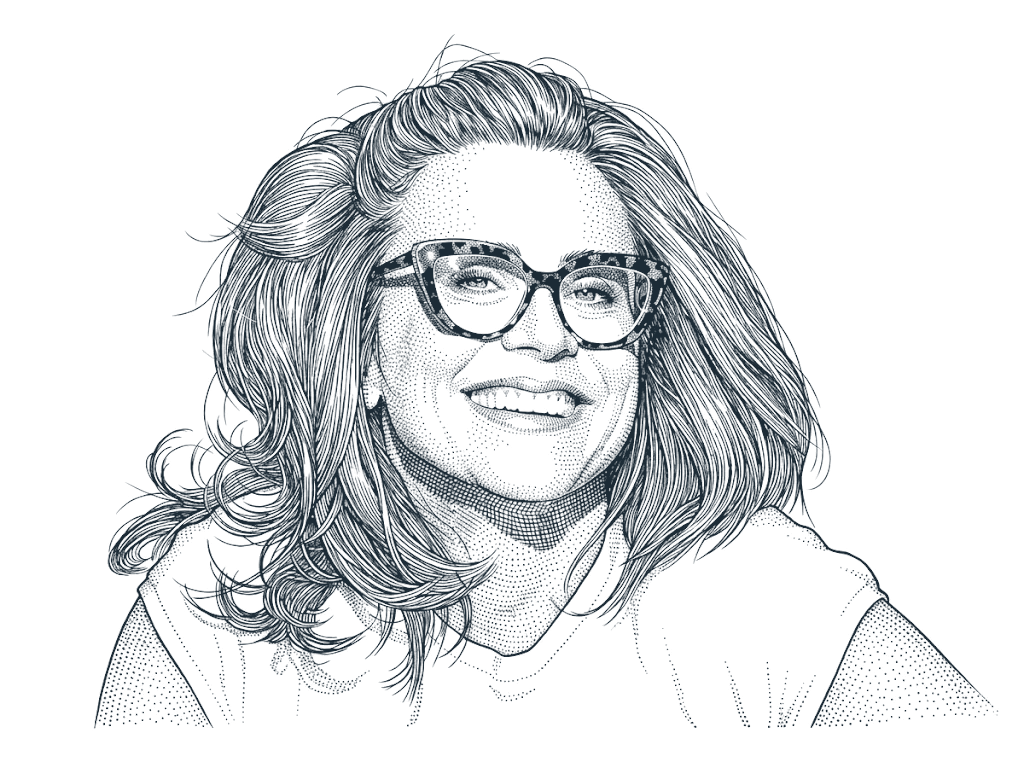
I'm a visual storyteller with a passion for
revealing order and beauty in the process.
Working from Berlin, Germany.
Throughout my career, I've been drawn to clarity. A throughline in all my projects is finding the core message so people understand the essence and actions flow seamlessly. Raised in the New York Metropolitan Area, I moved to Pittsburgh, PA, to study Communication Design at Carnegie Mellon University.
I was drawn to breaking down complex problems and explaining them clearly, backed by visual sensibilities and technology. I joined the Chicago Tribune as a Visual Journalist and helped move visual explanations online with early interactive graphics.
From 2009 to 2019, I built user experiences in the San Francisco Bay Area. I returned home to the East Coast in 2019 and focused on large-scale banking. Now in Berlin, I'm teaching Data Storytelling to University Students.
Recent work
All work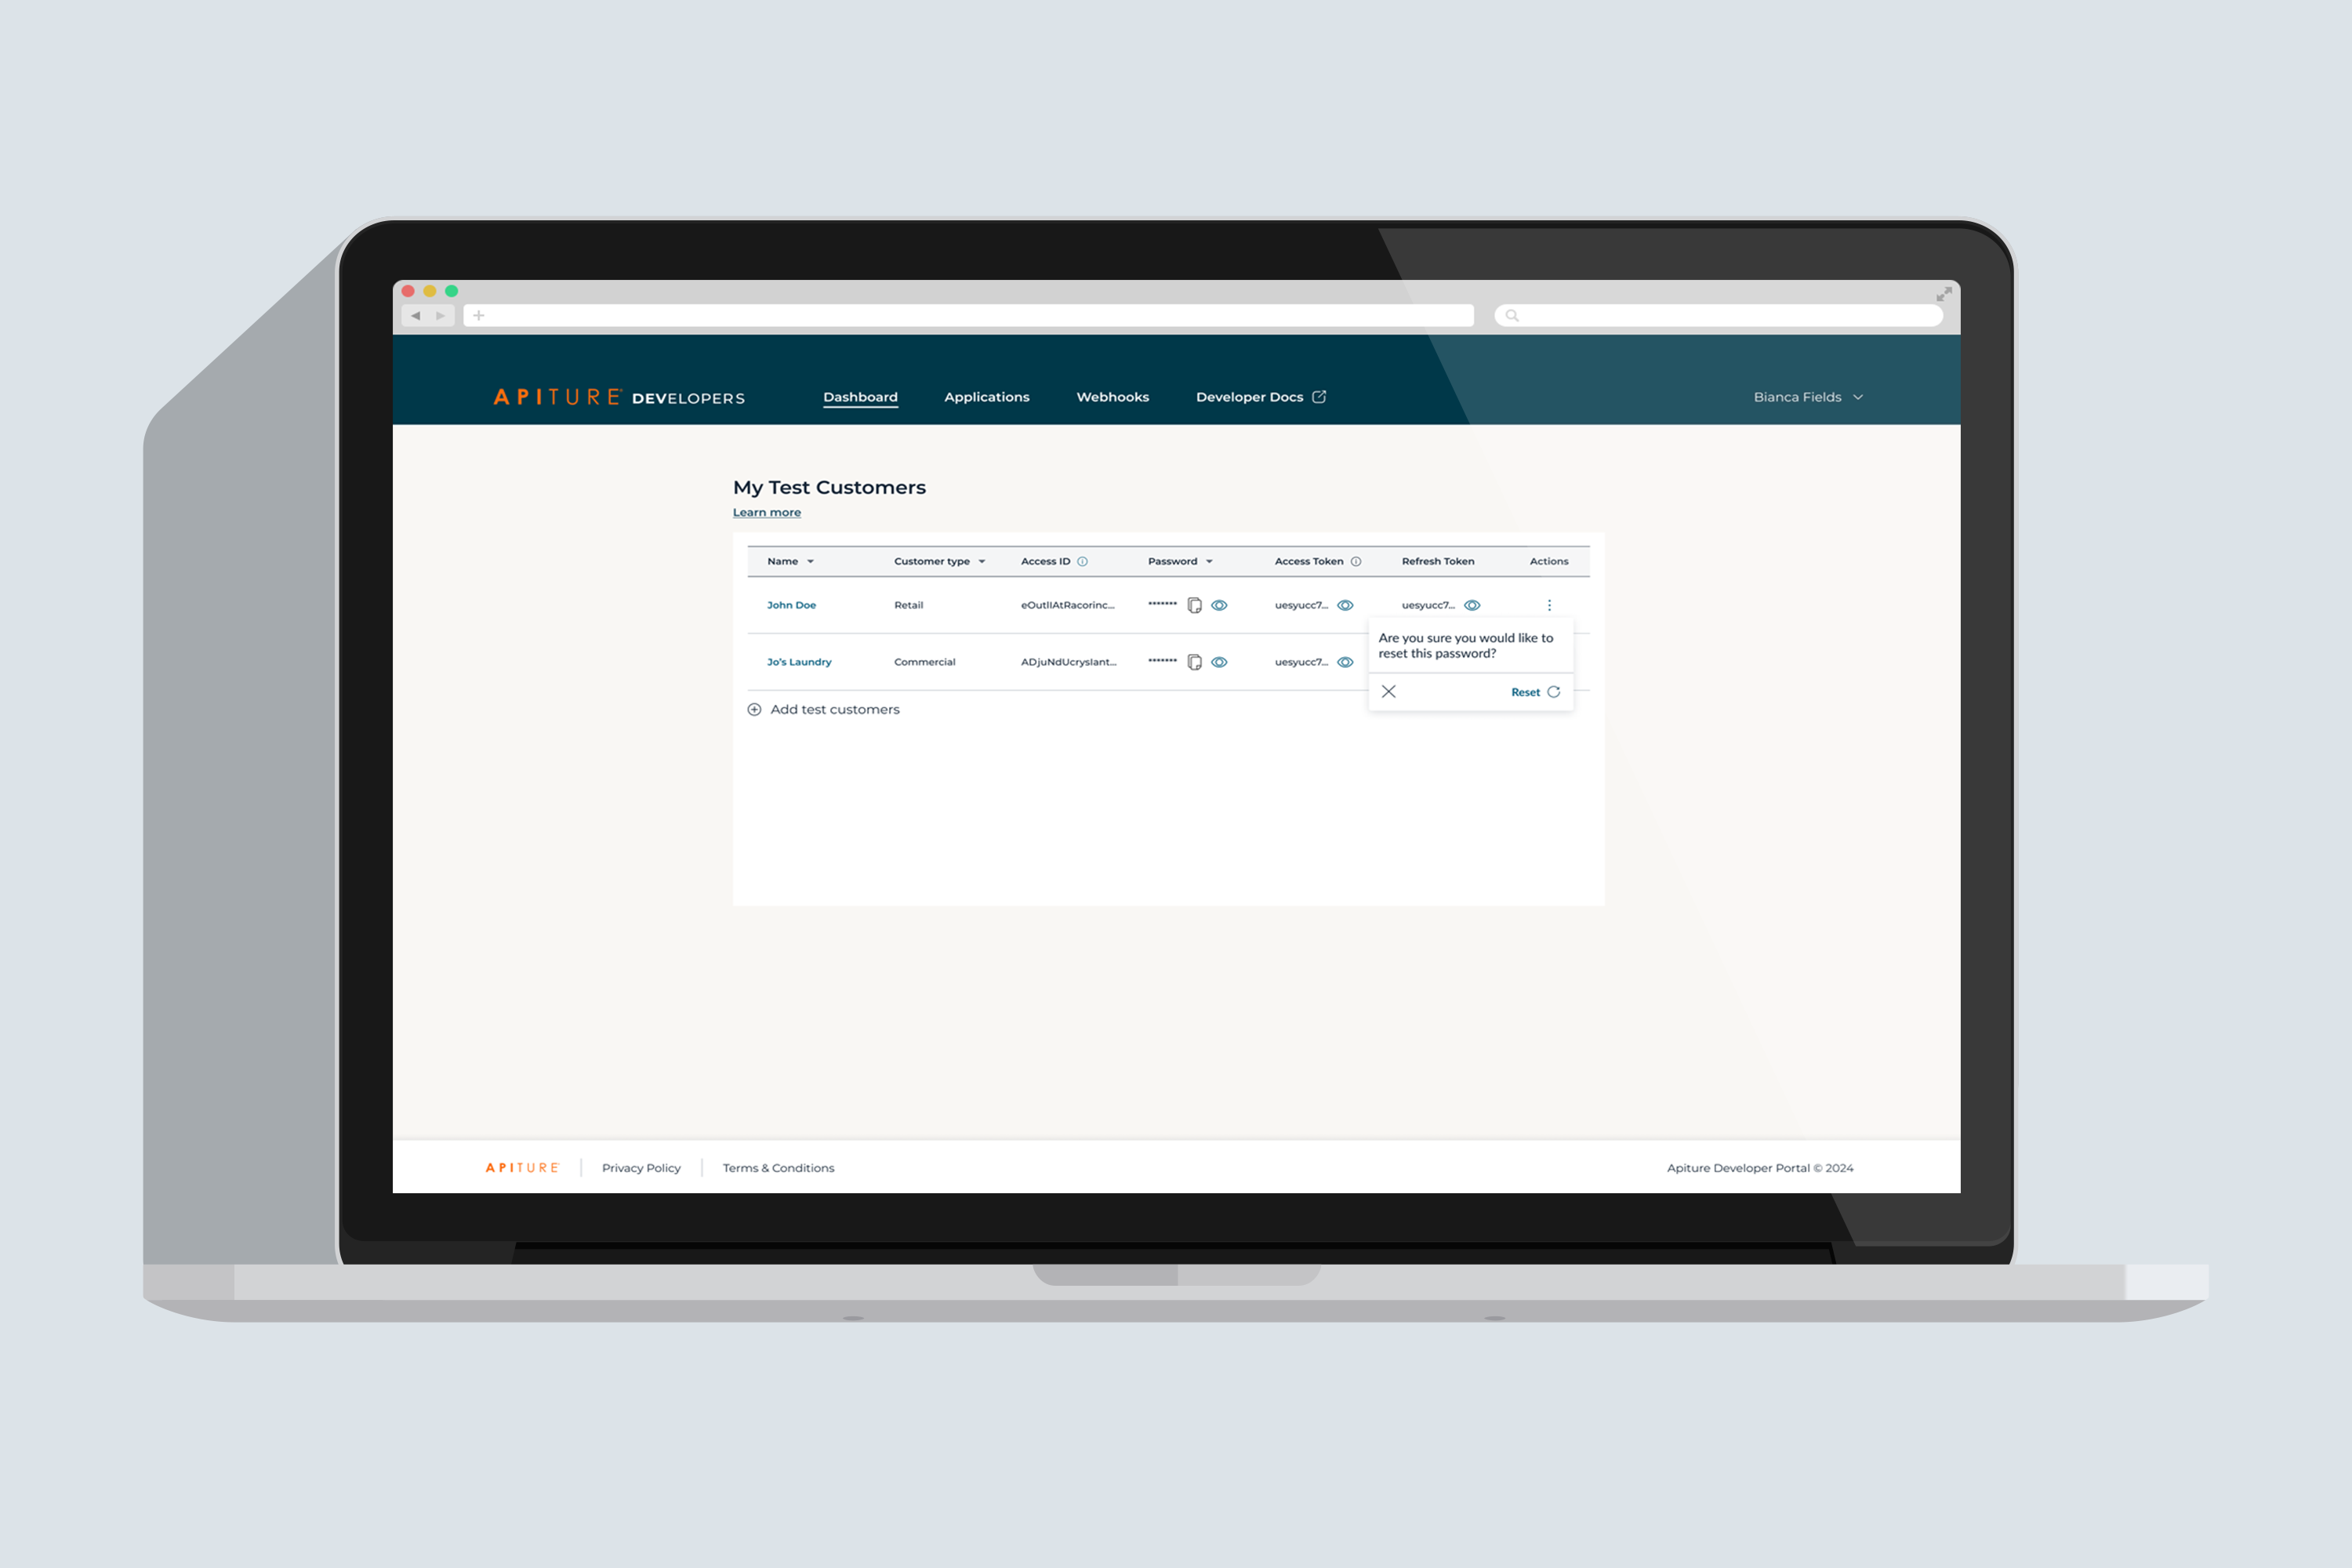
Apiture Developer Portal
Designed features for the Developer Portal and created a design system library.
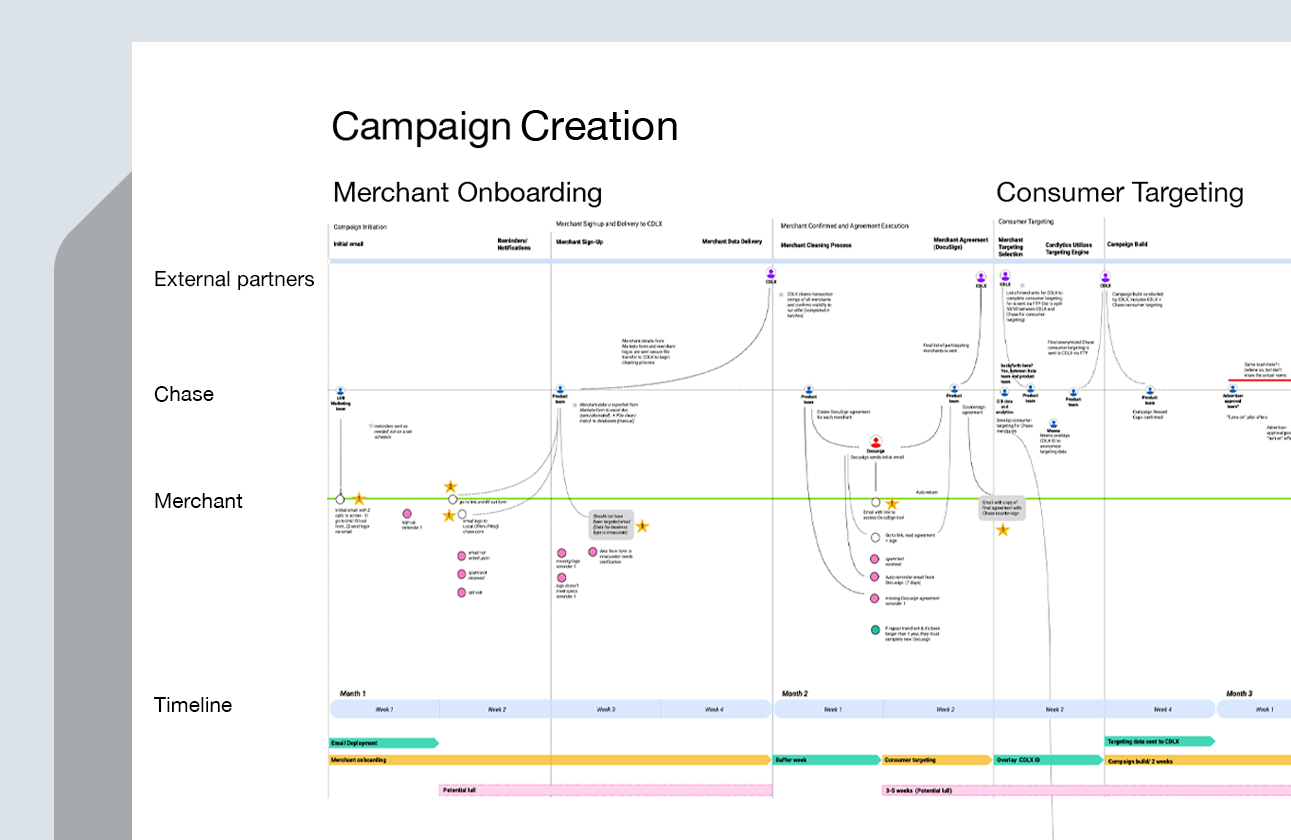
Service Design Reveals Insights
Utilized a Service Blueprint to Enhance the Campaign Creation Process
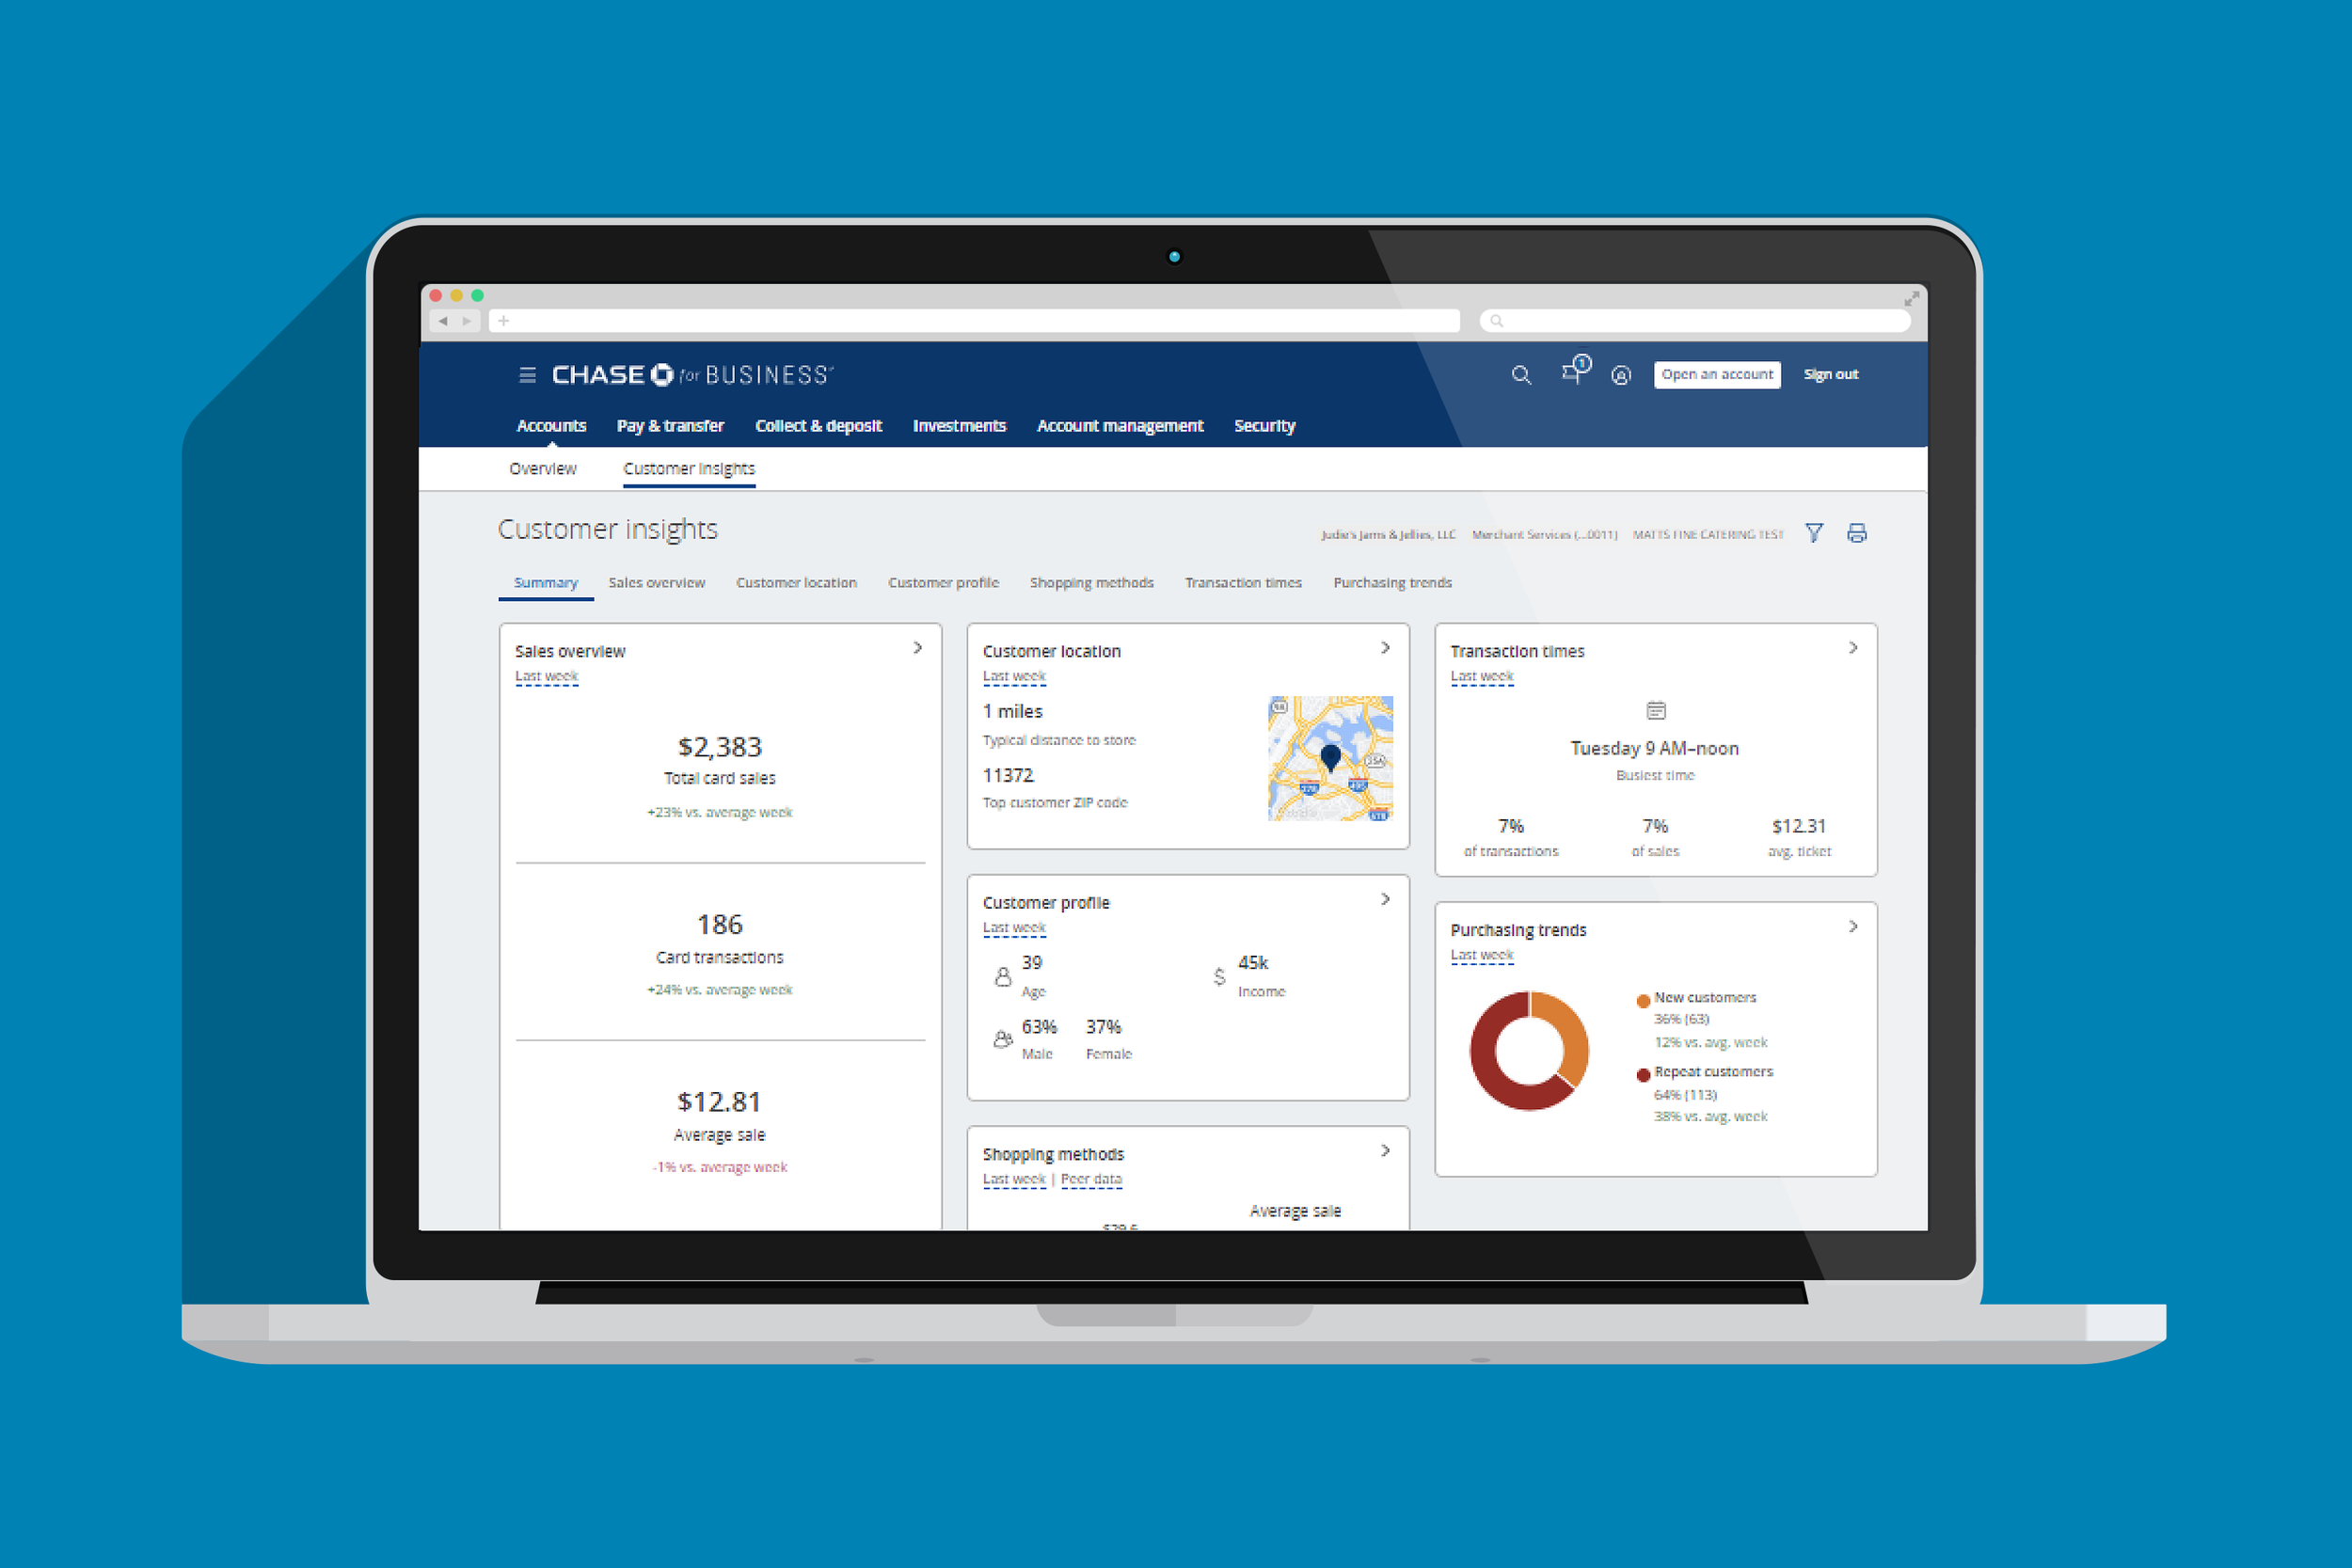
Increased Engagement in Business Banking
Introduced a tab structure to the platform that resulted in an increase of 400% user engagement.
More projects
2004–20212019-2021 Interactive Visualization Designer
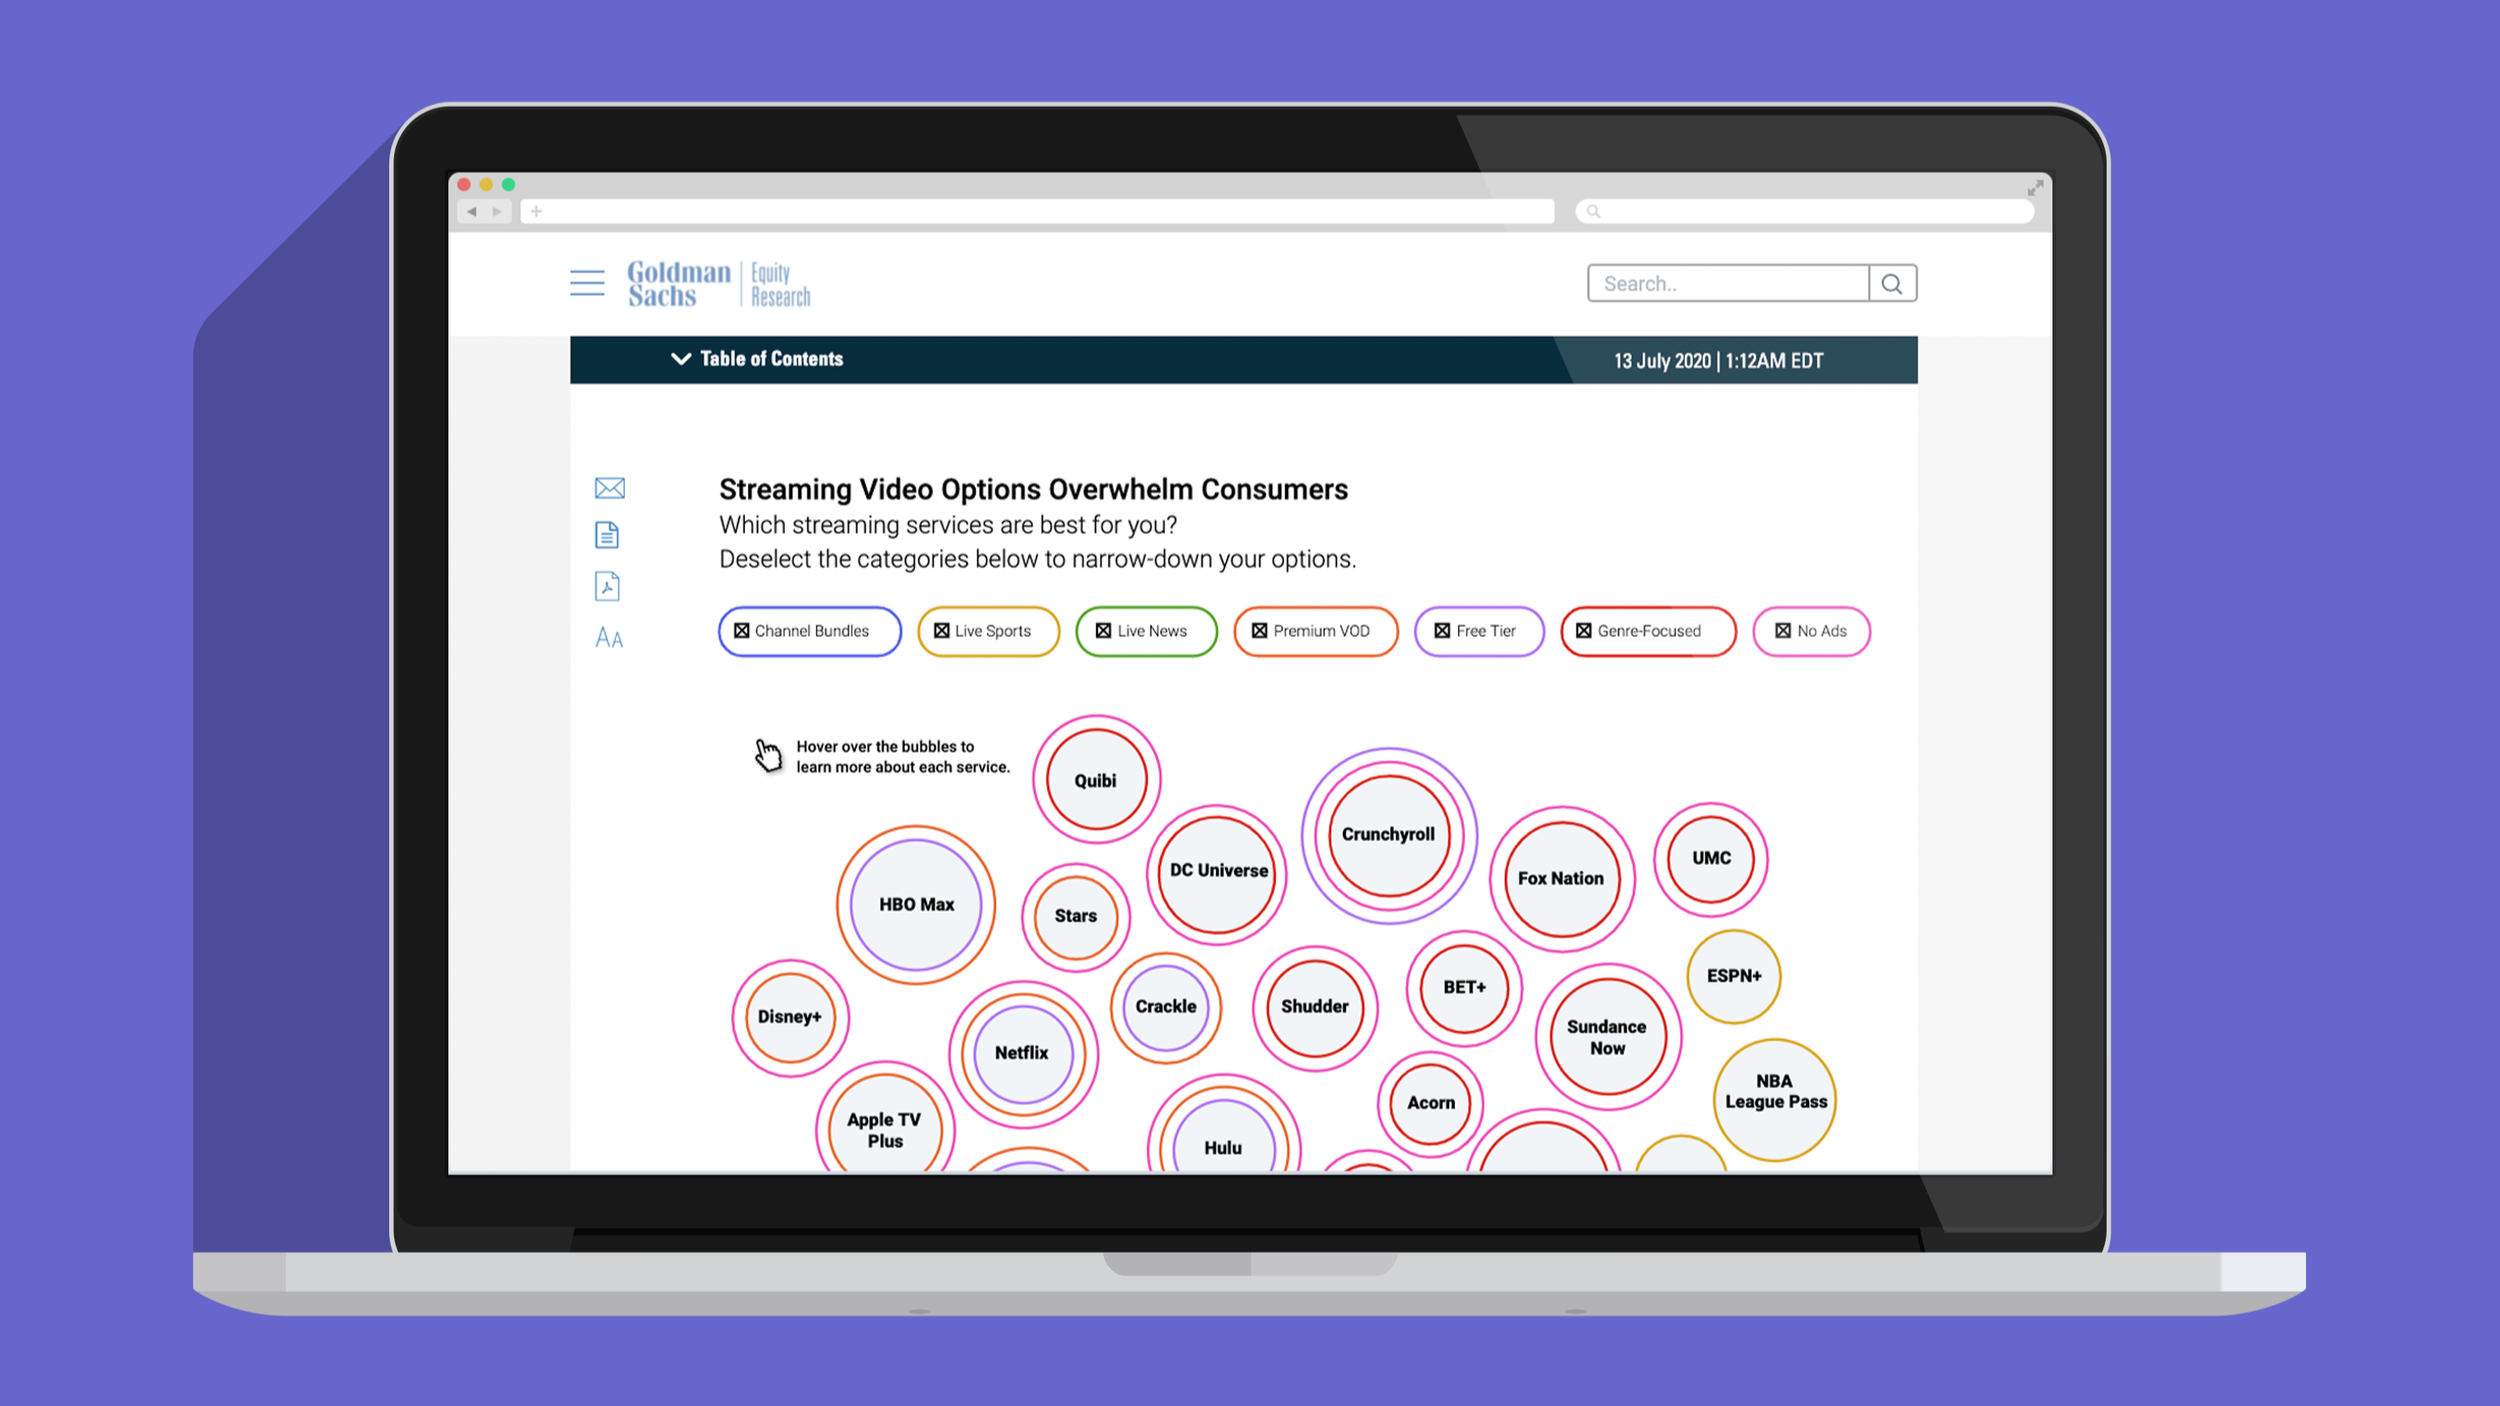
Created interactive graphic displays to help Analysts visualize stories for the Goldman Sachs Research Portal.
View project2018-2019 AI + People Analytics
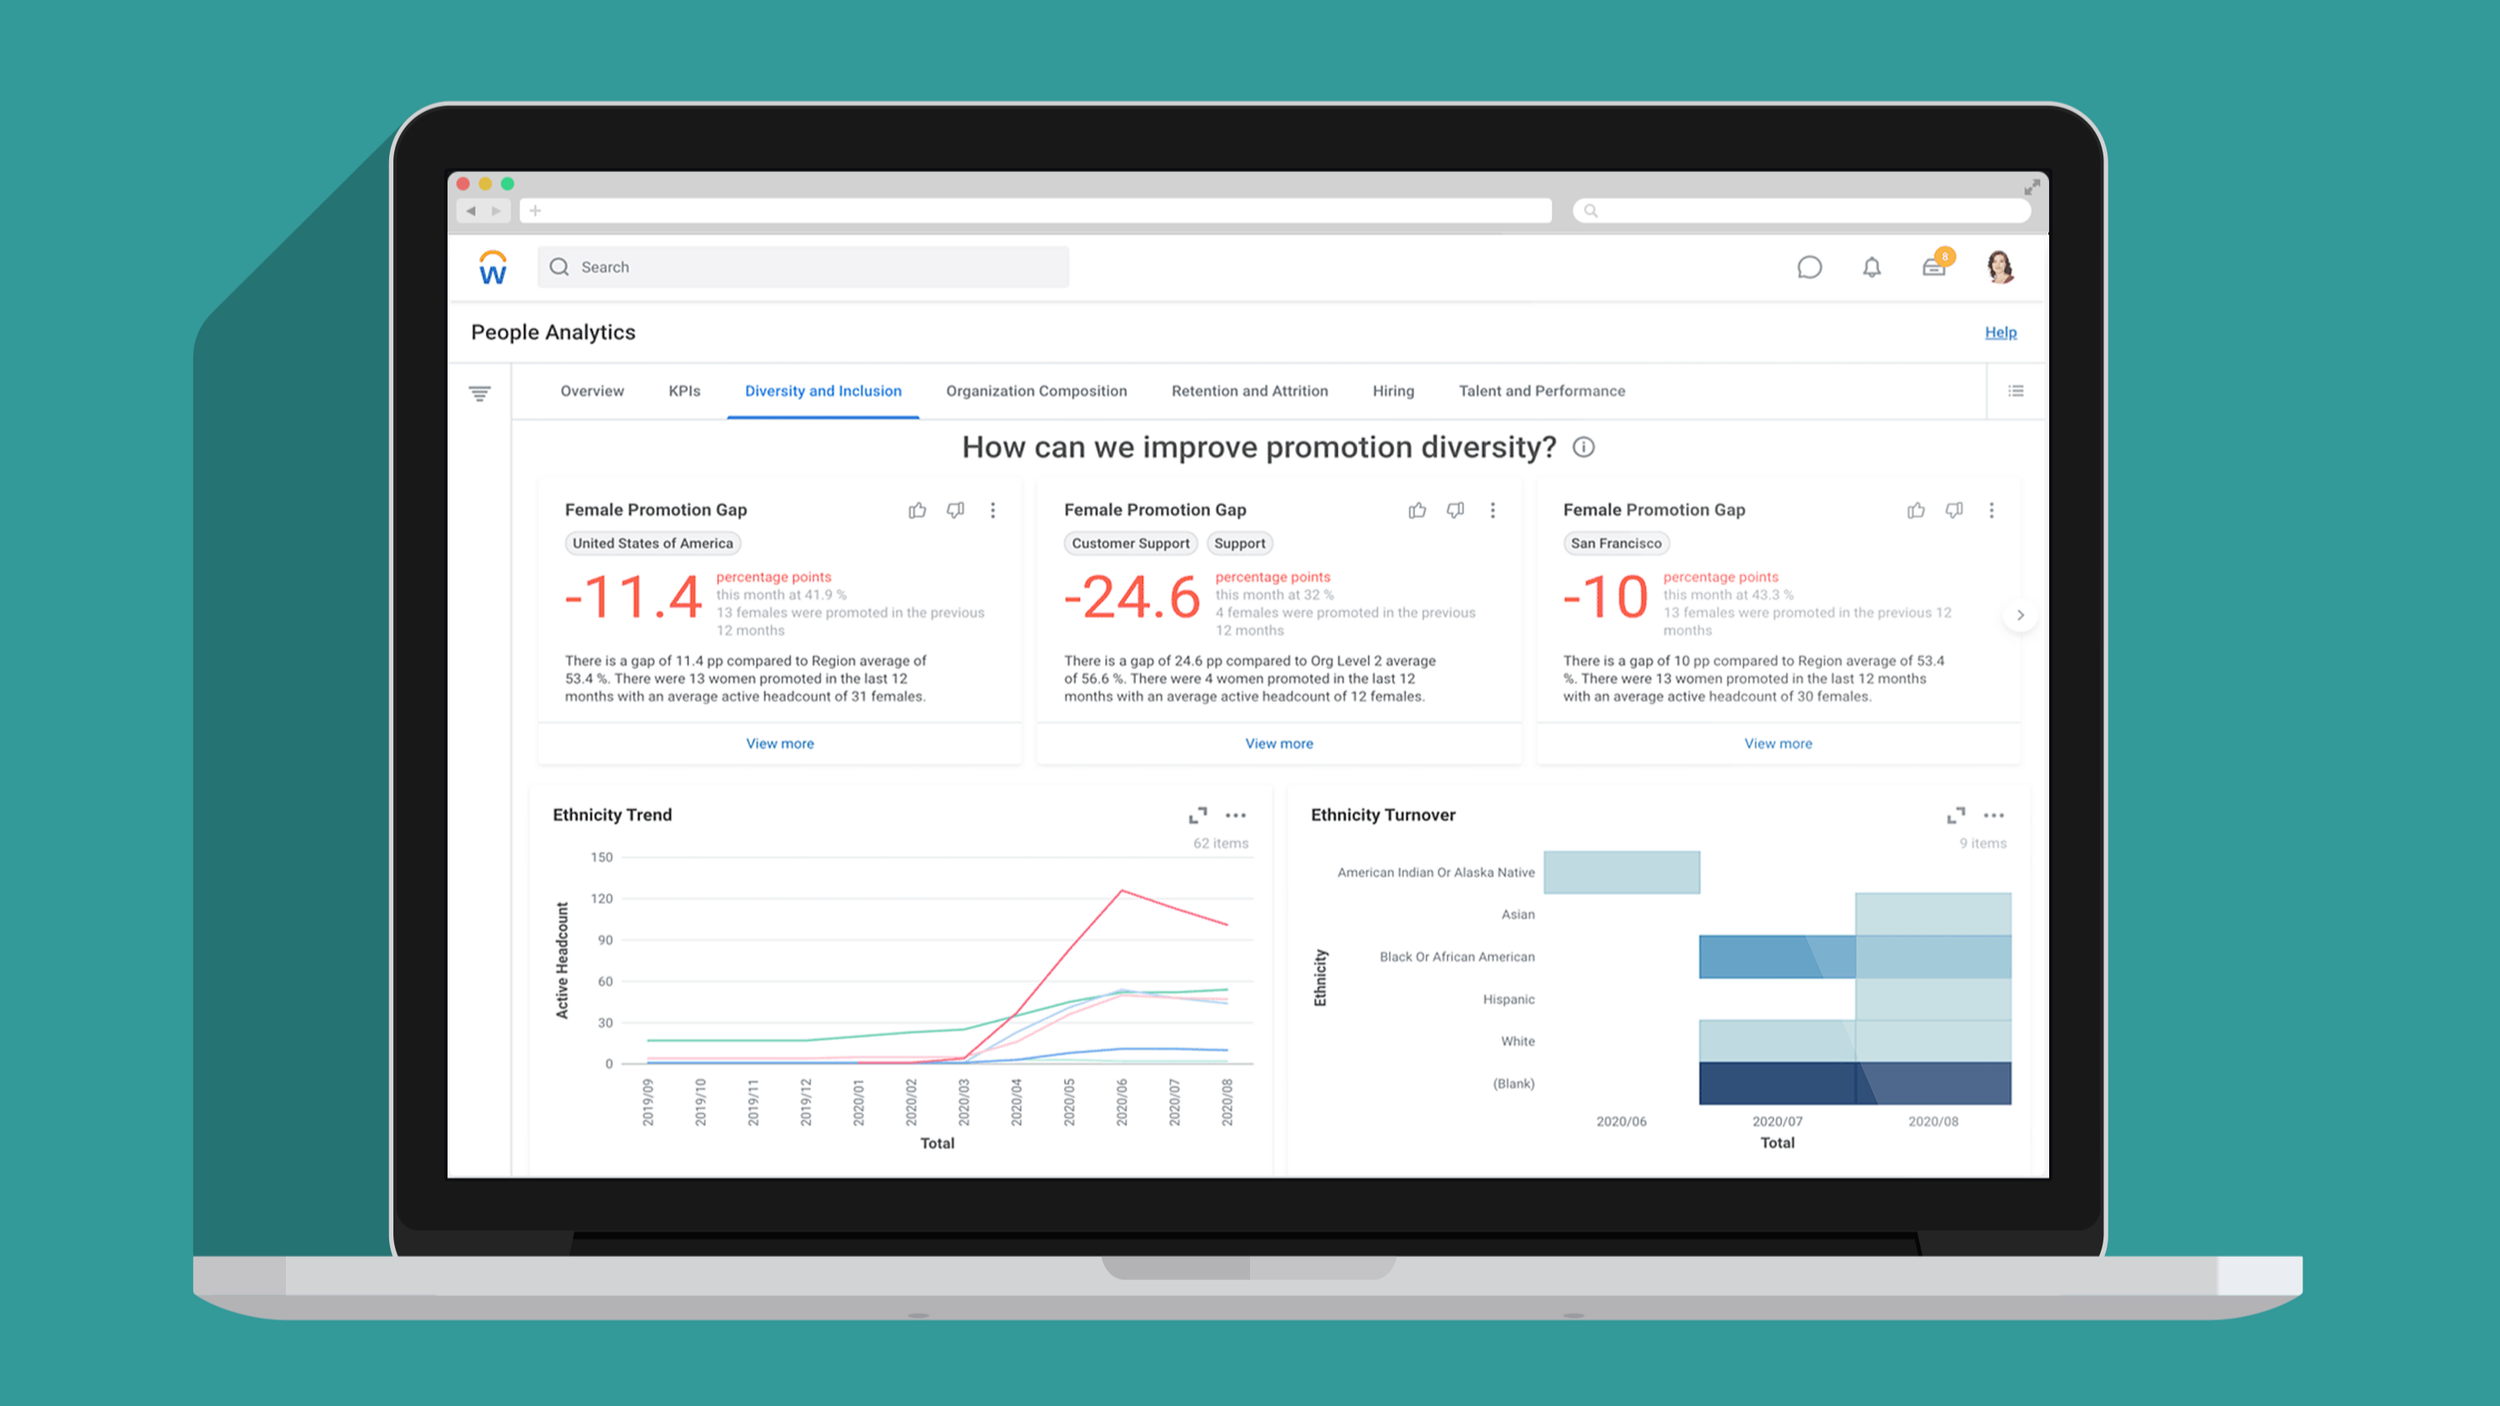
Conceptualized and built a platform that surfaced data for an AI powered product.
View project2018-2019 Chart Accessibility for Workday
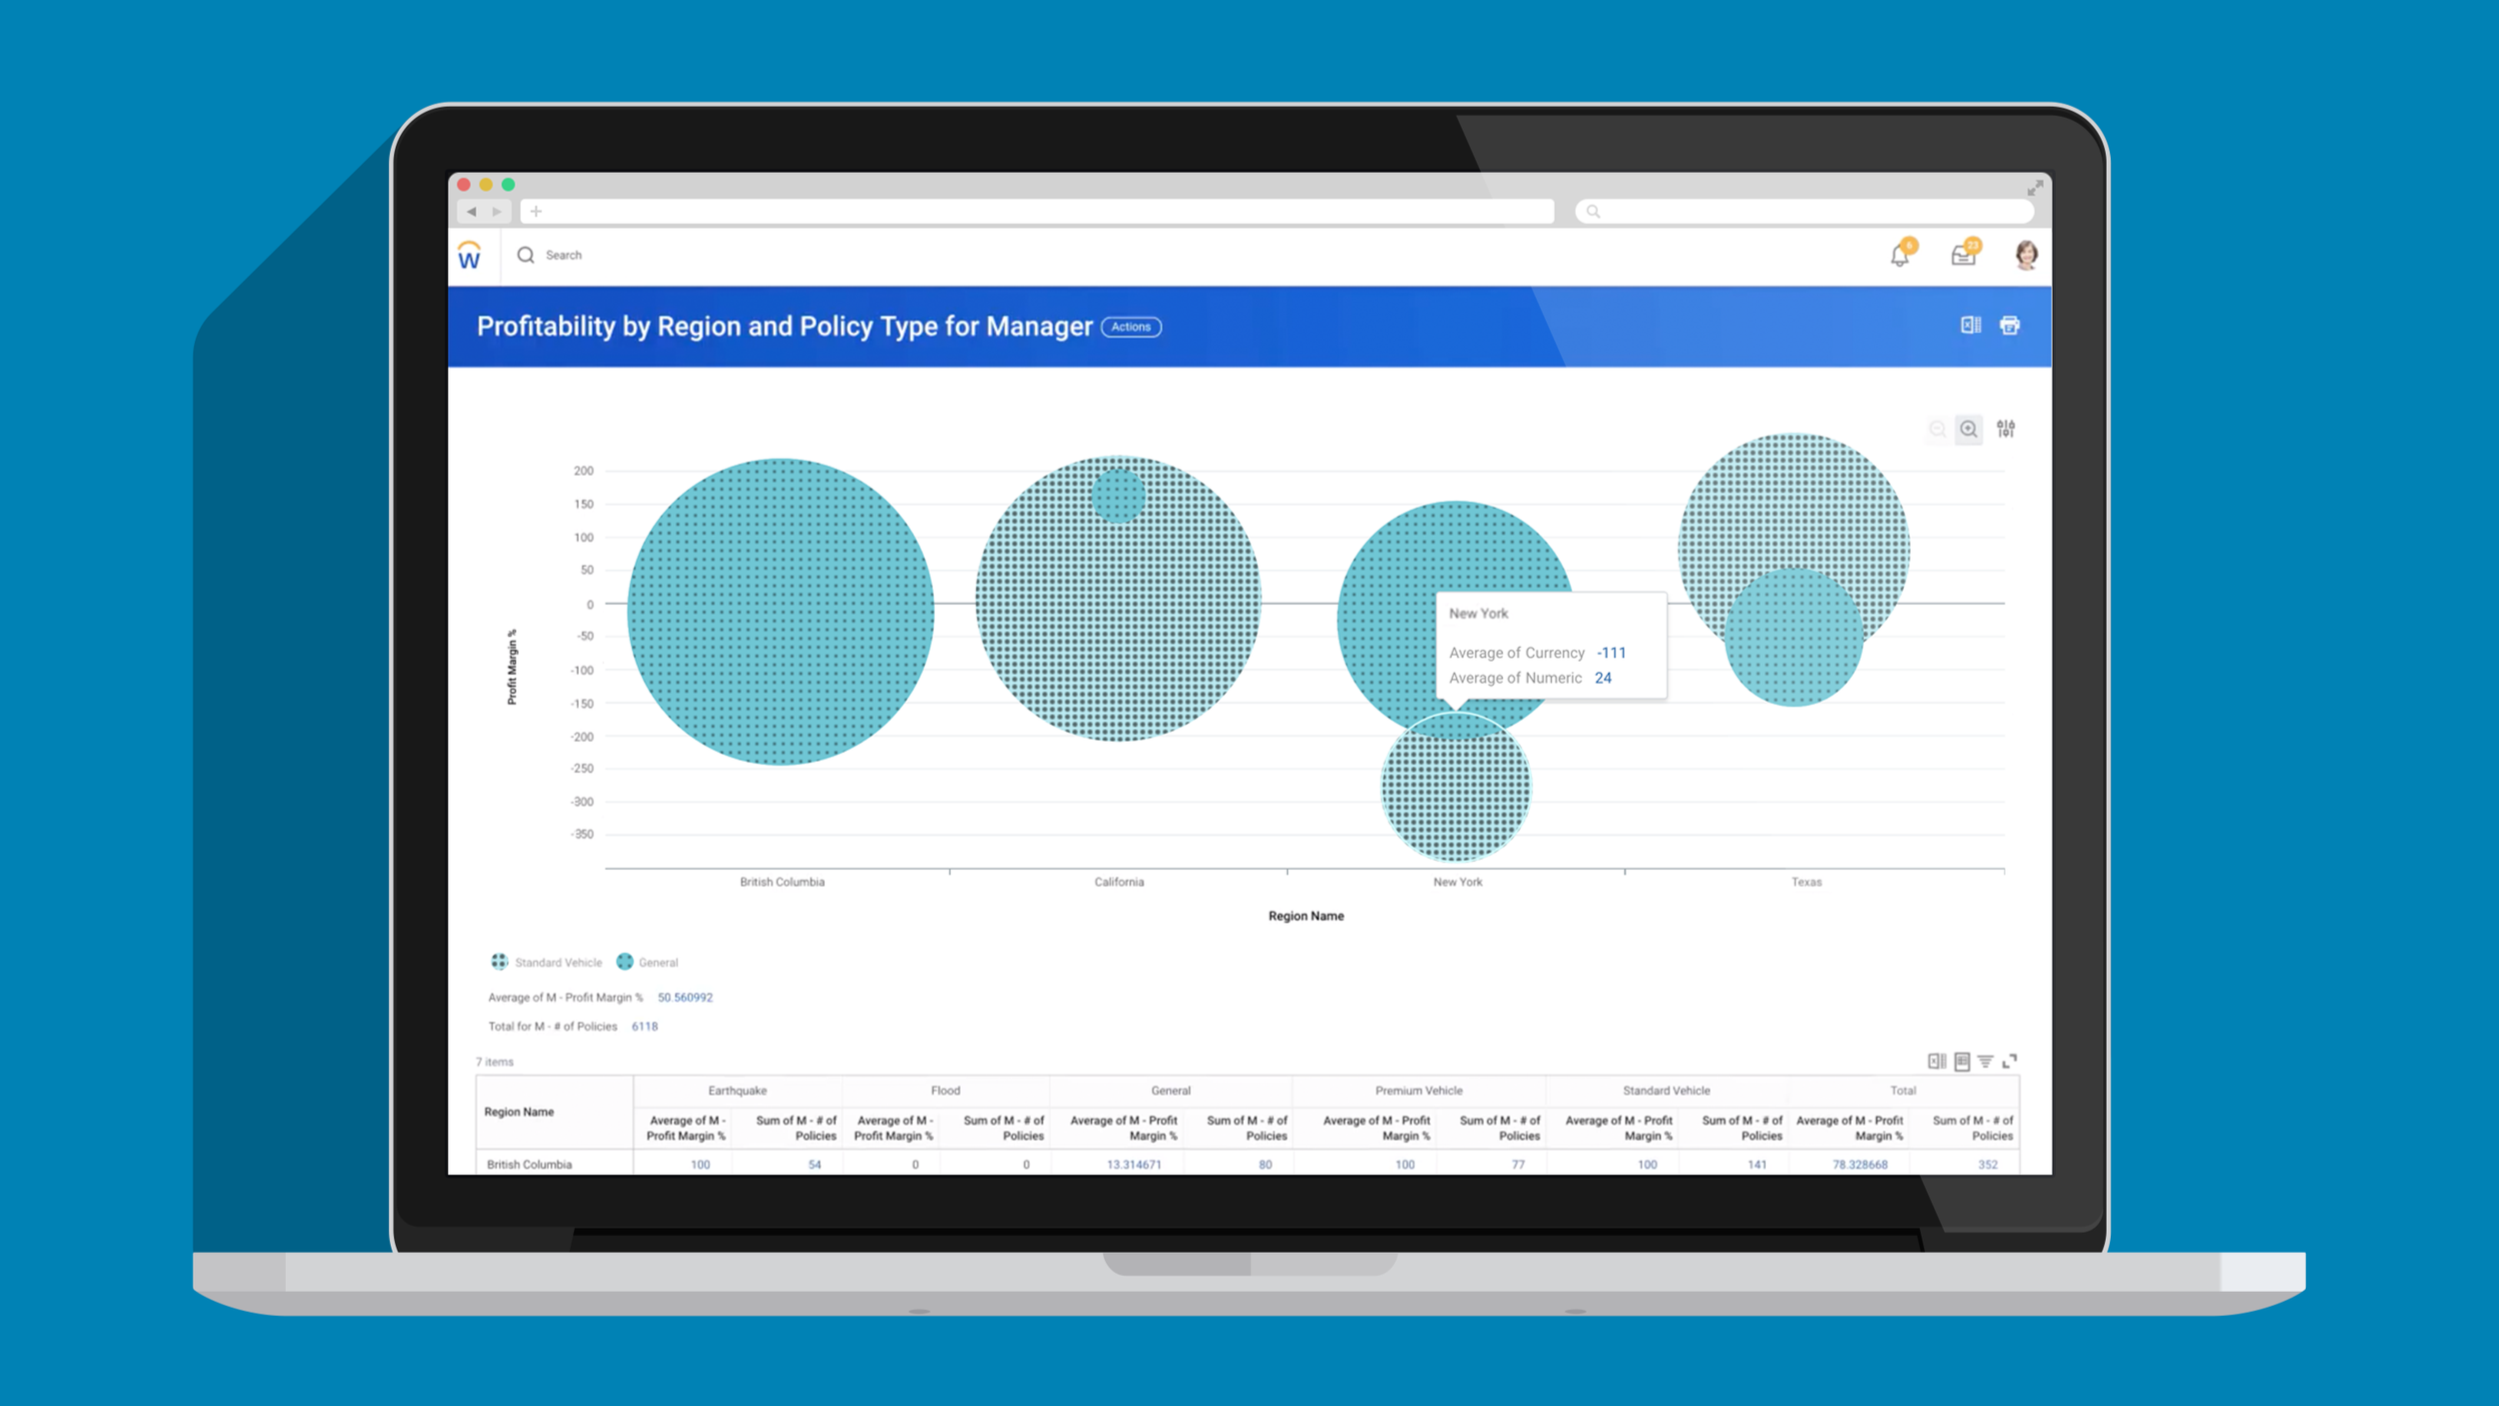
Providing accessibility to Workday's charts.
View project2017 Redesign of Fitbit Help
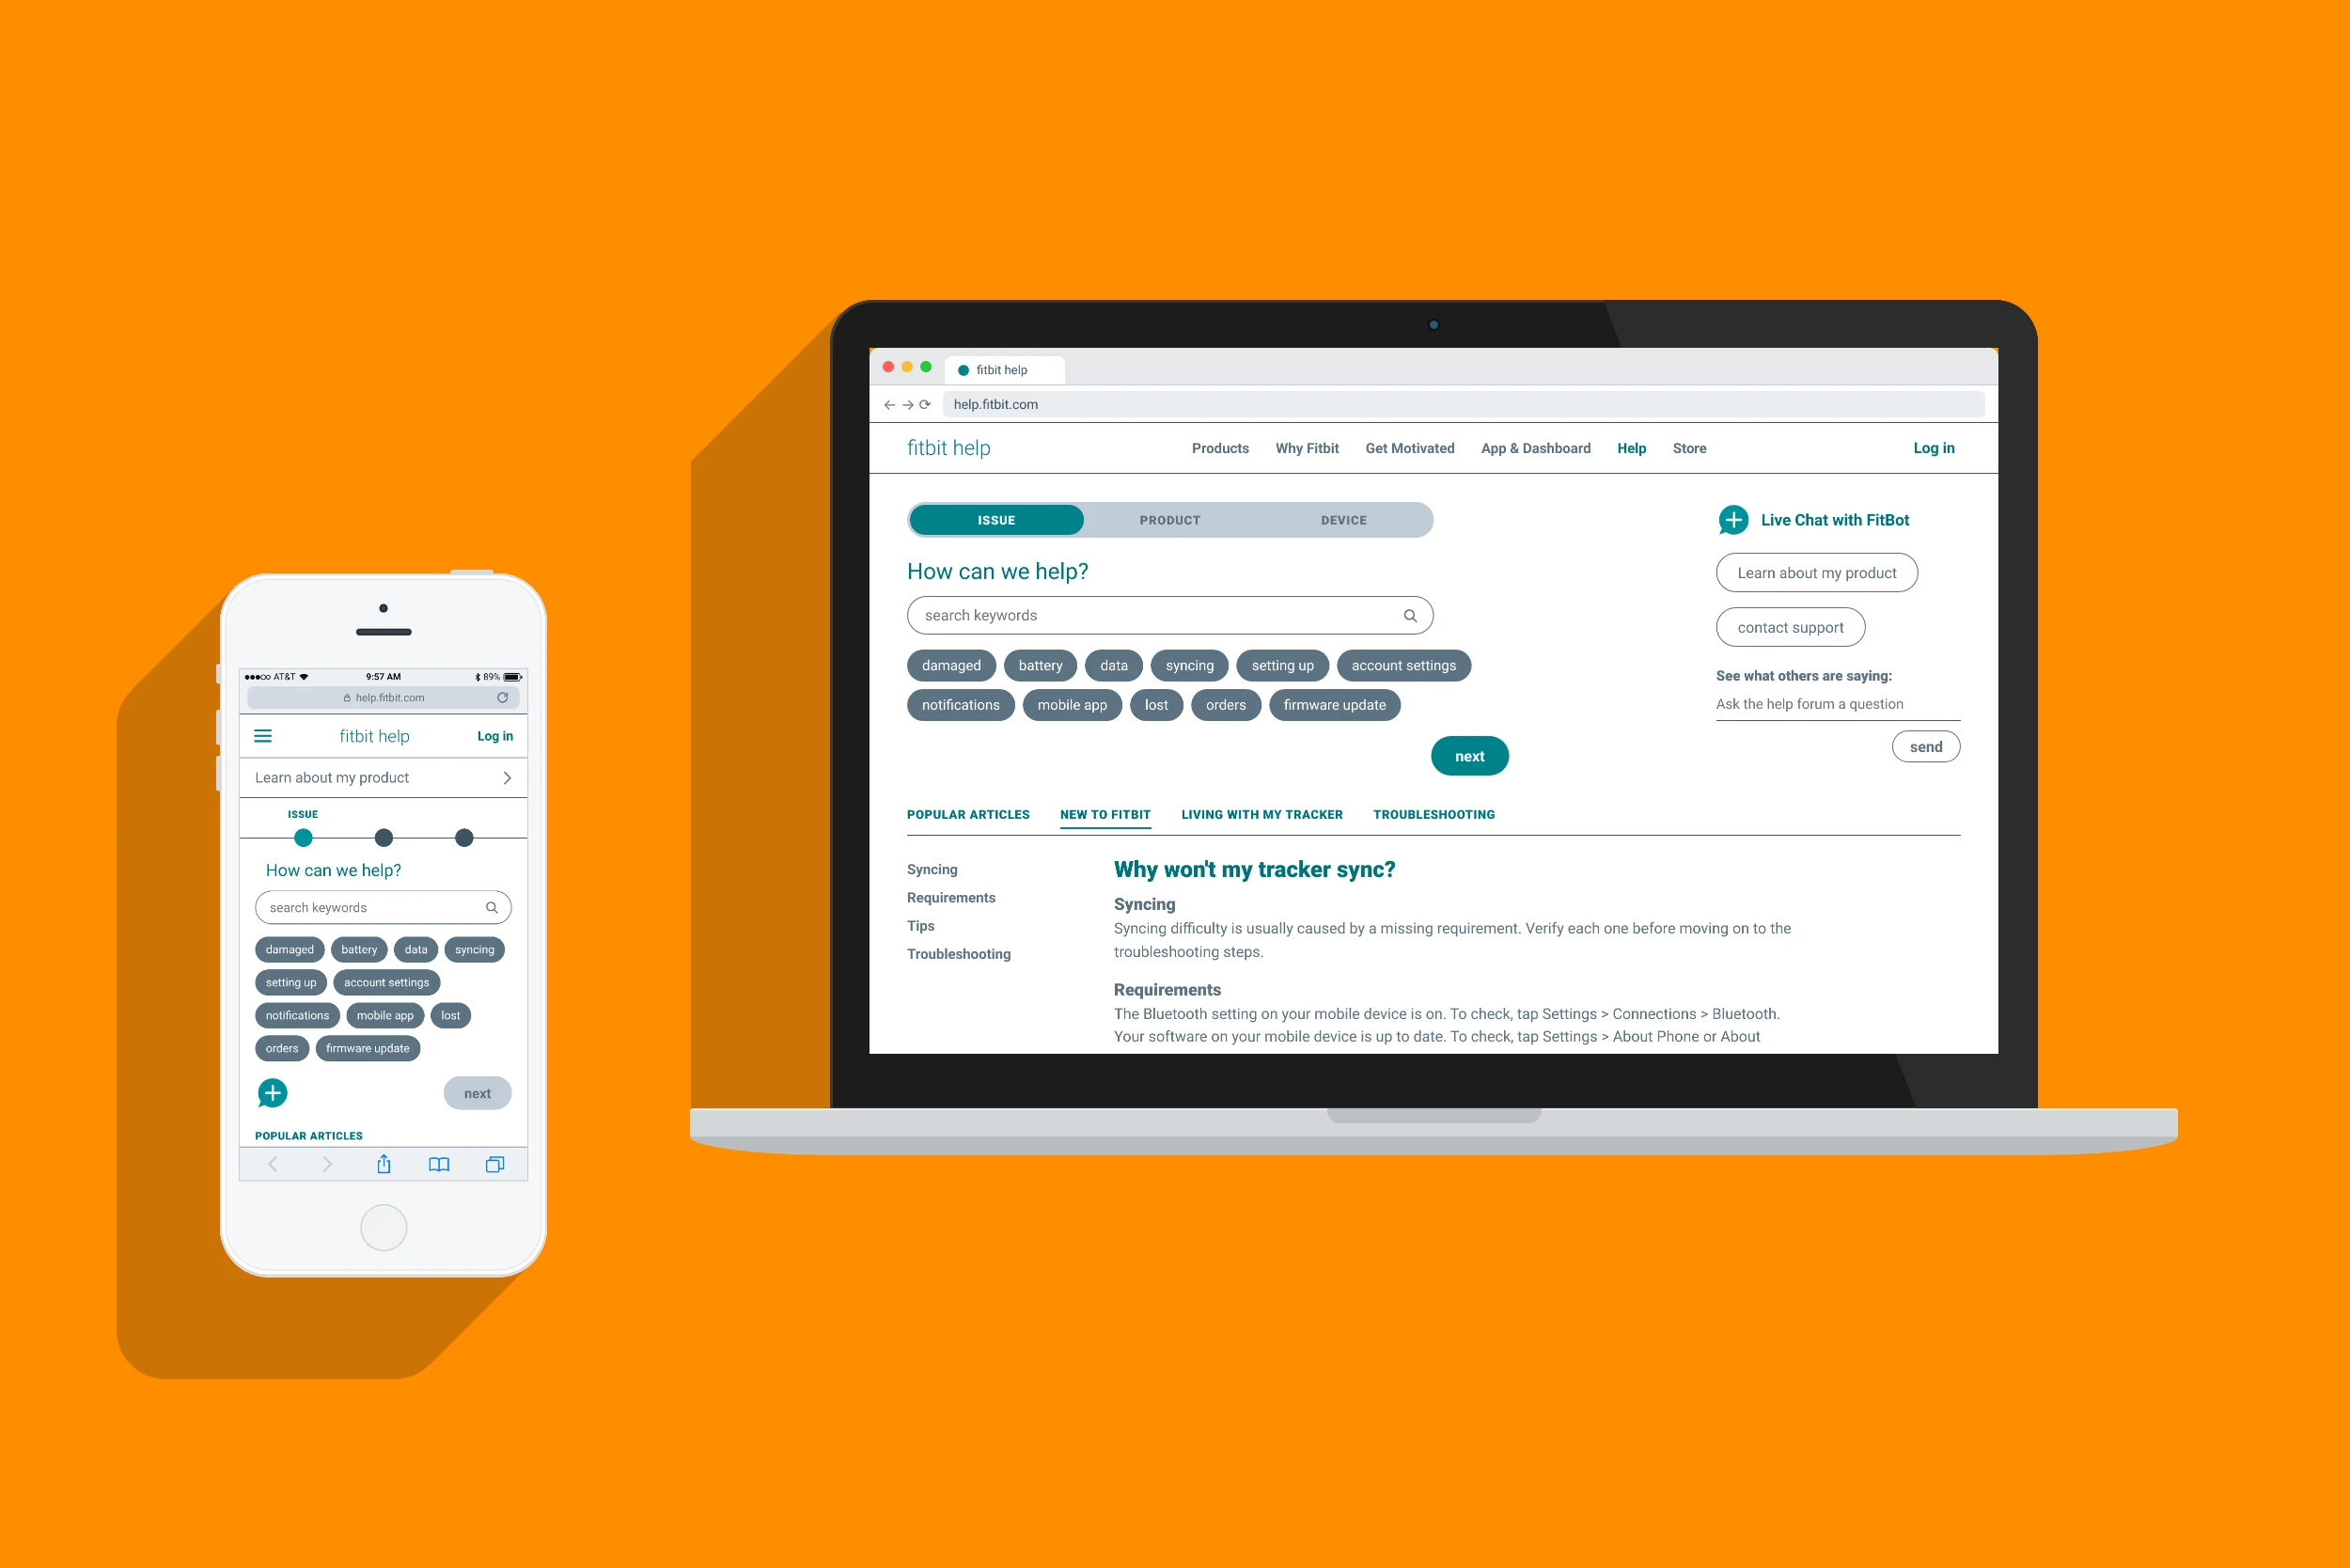
Redesign of Fitbit customer support to encourage users to use the self-service platform instead of calling.
View project2017 UserTesting Competitive Benchmarking
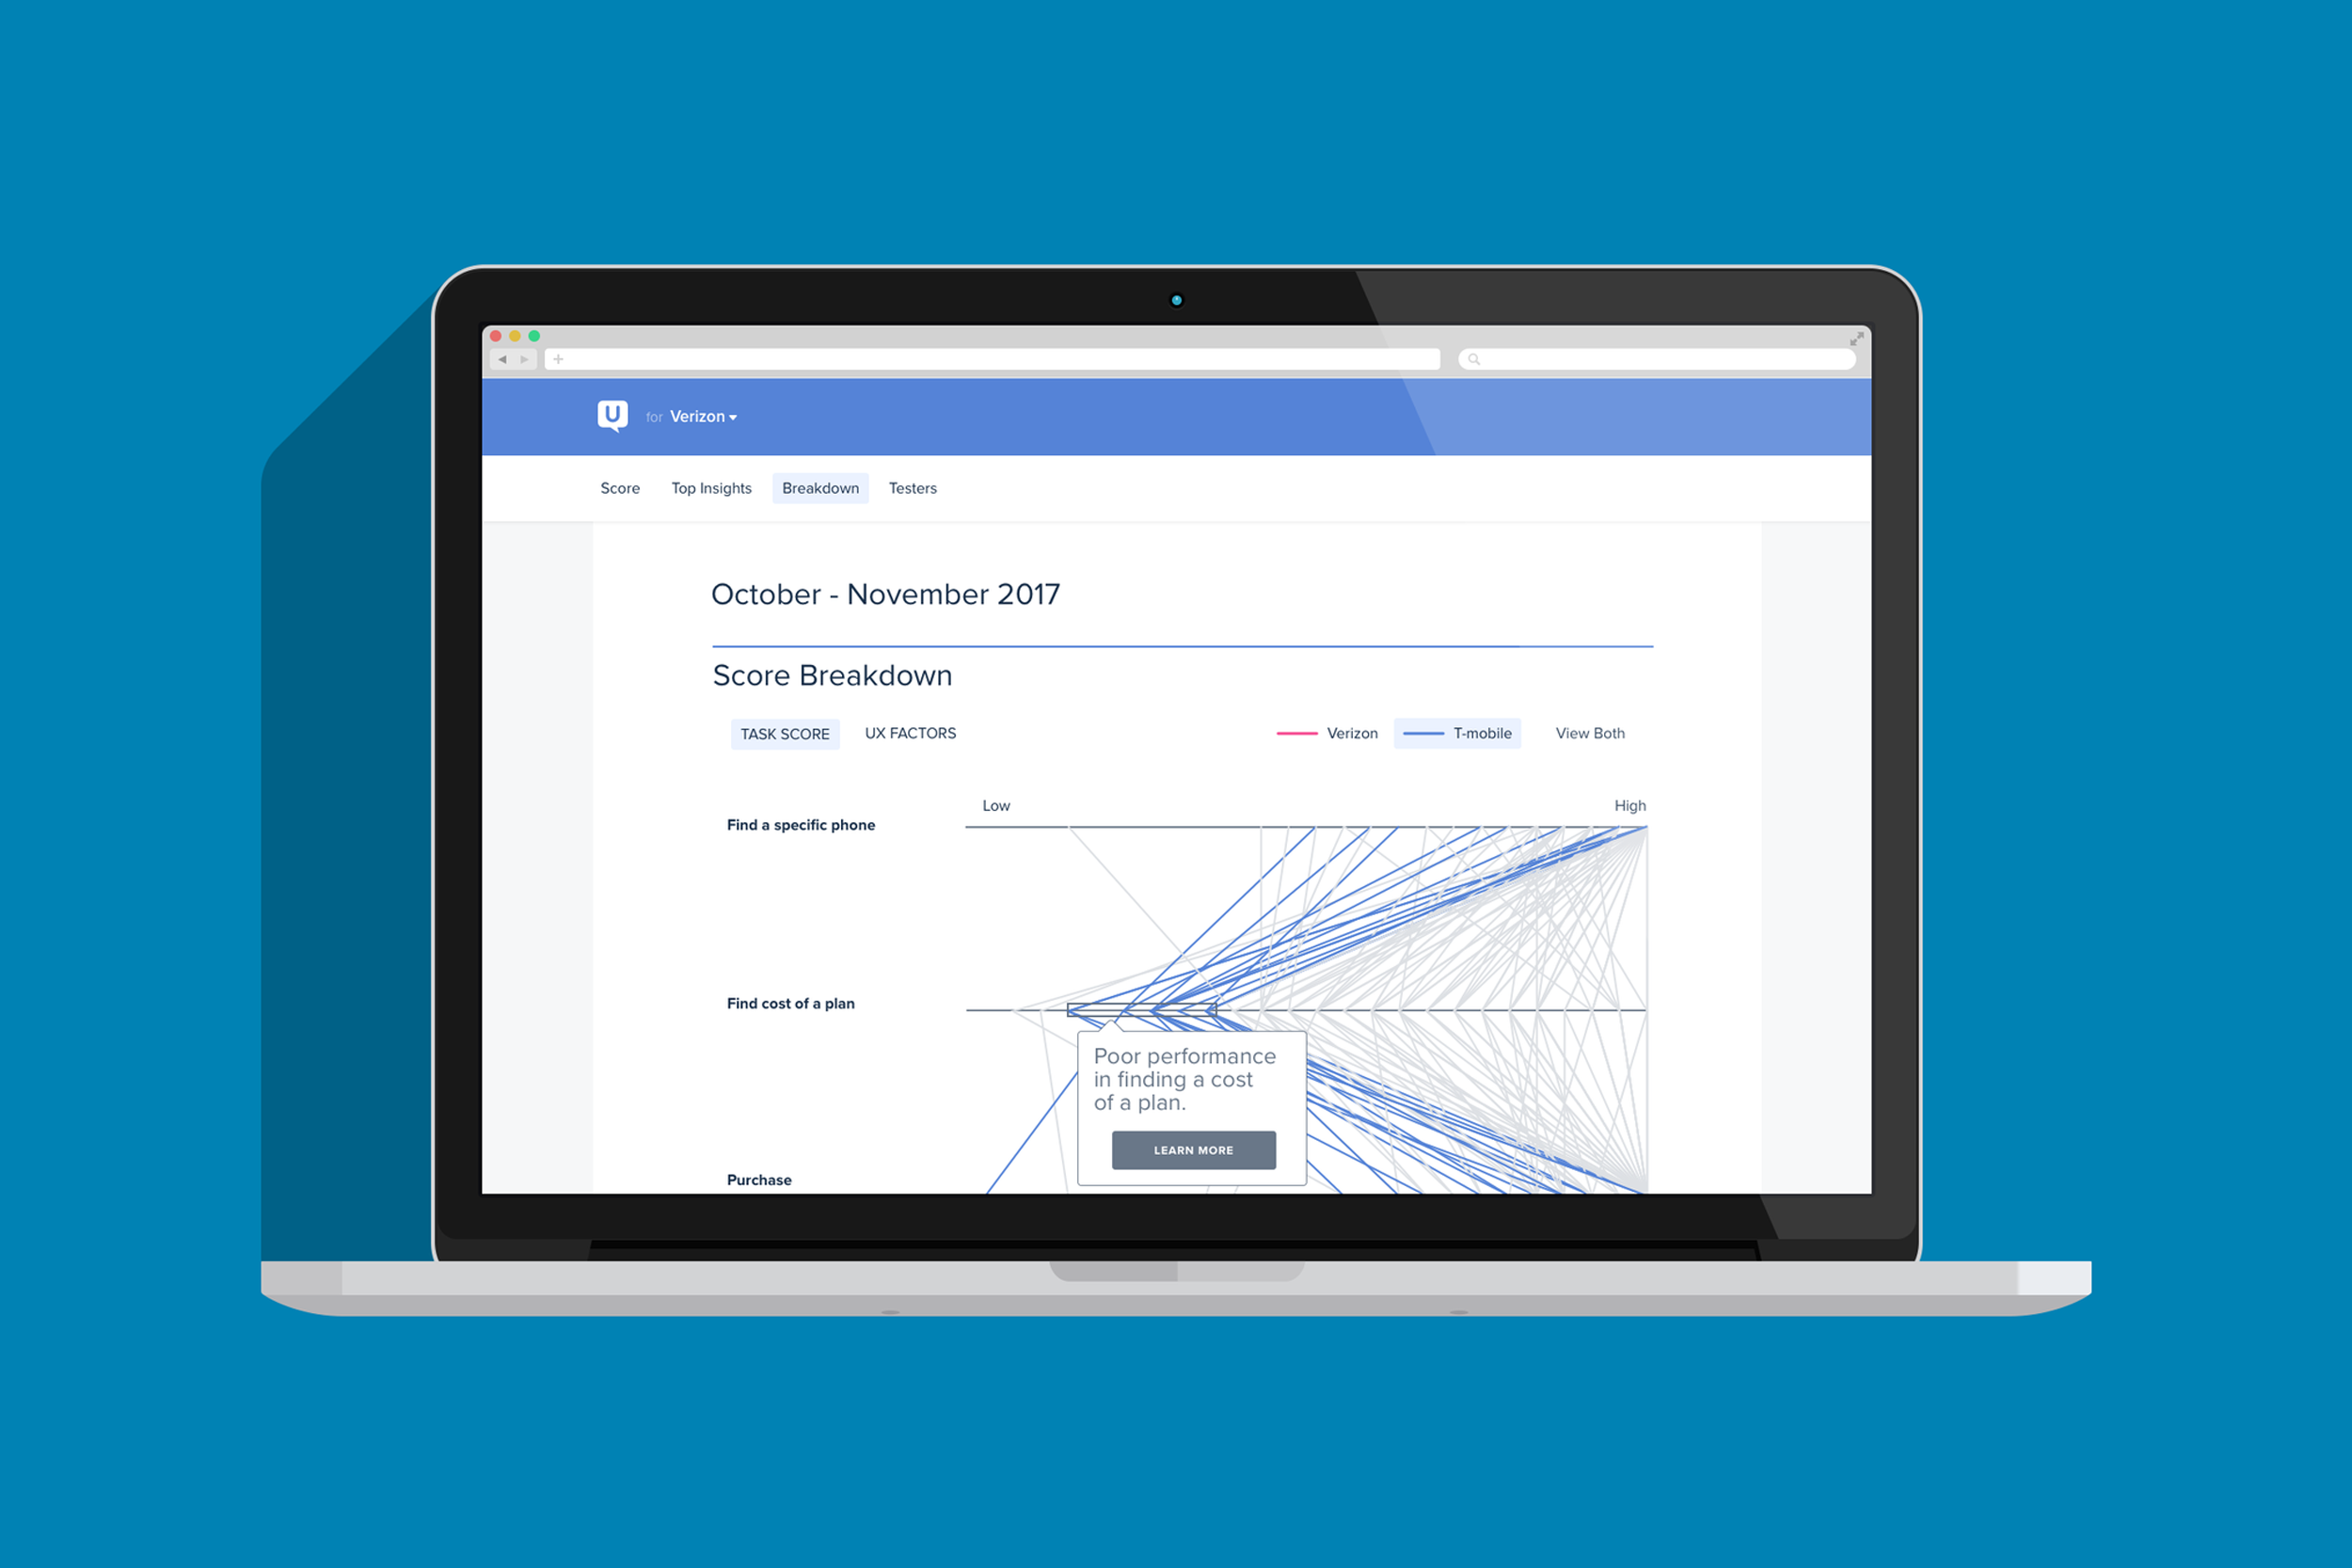
A visual way for executives to compare their product's UX against their competitors' over time.
View project2015-2016 Epsilon Marketing Engine Tool
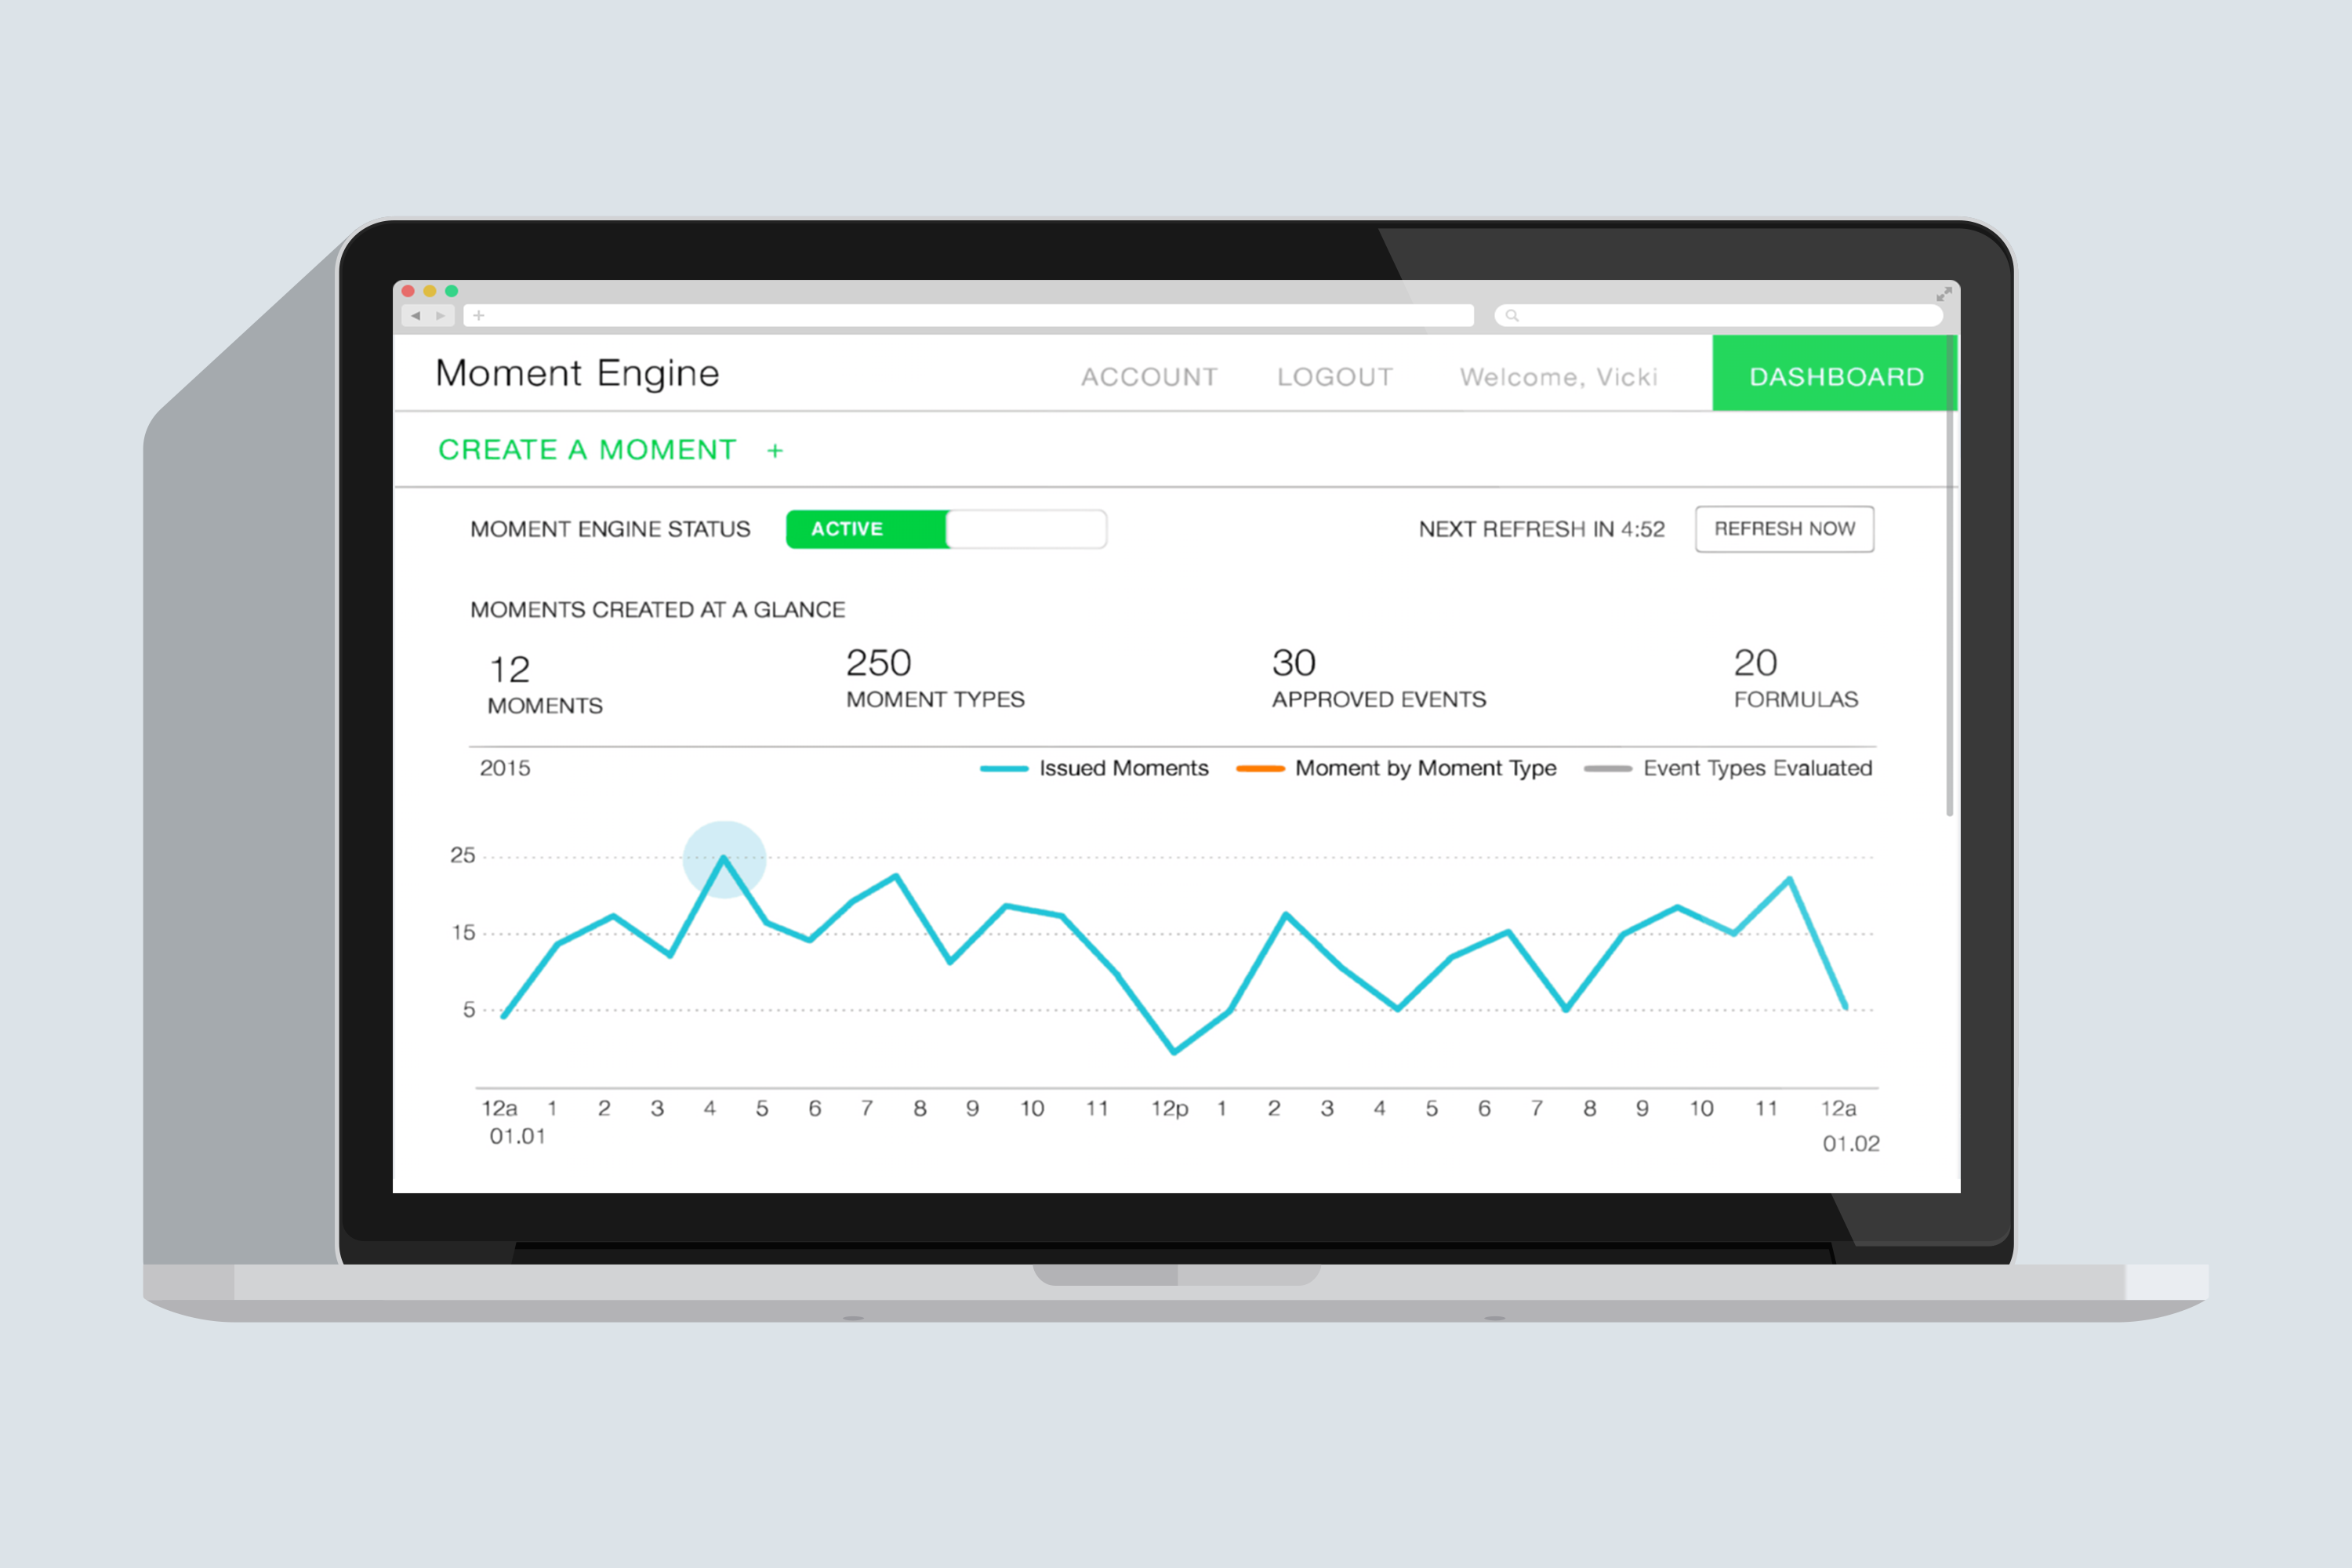
Bringing order to a complex marketing engine with a system model.
View project2014 Girl Effect iPhone App
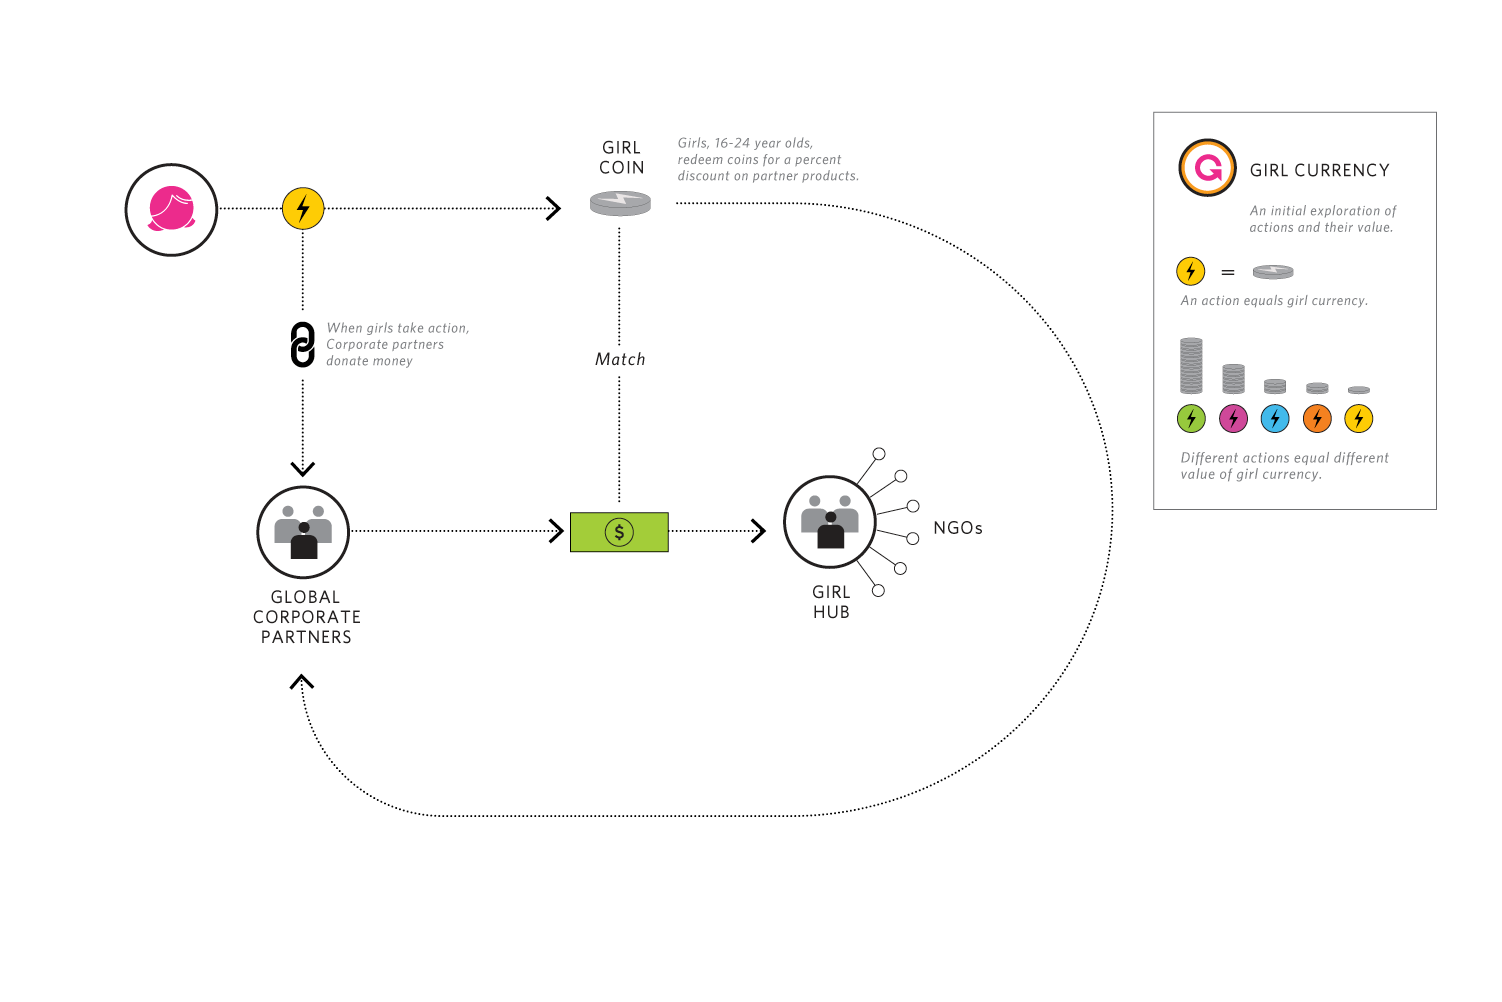
How Girl Effect could develop a digital currency to fund NGOs that supports girls in developing countries.
View project2013 Google Express
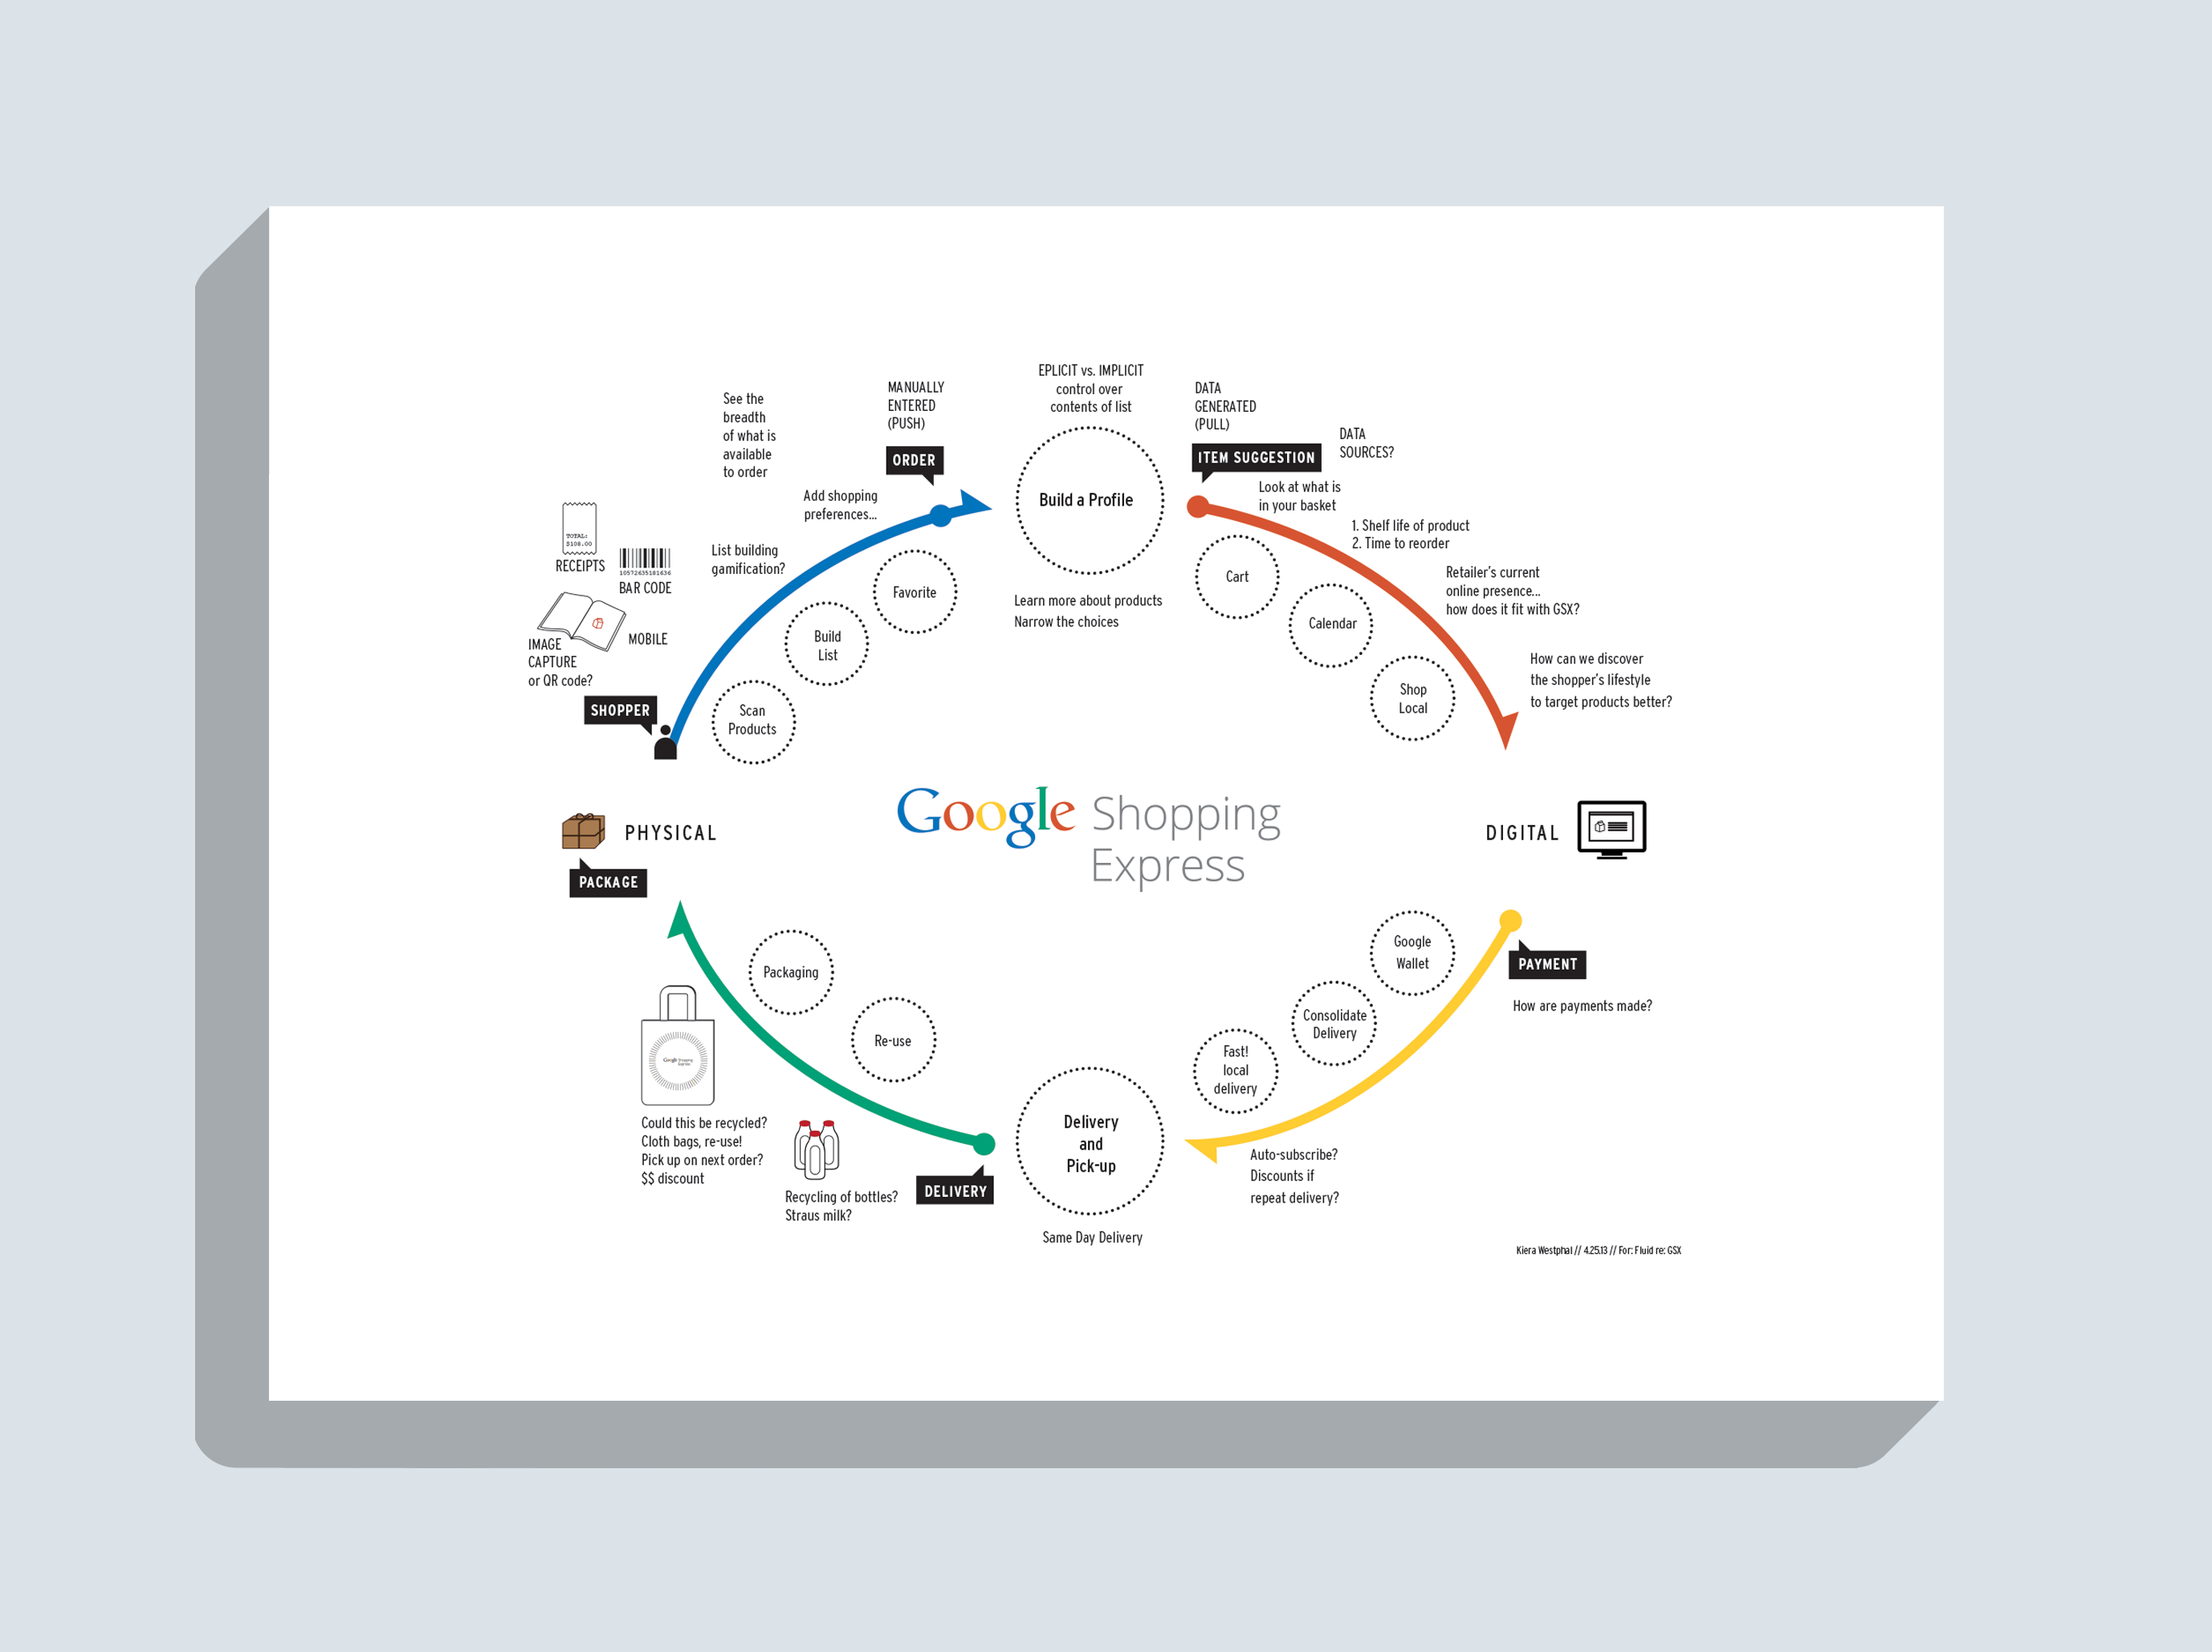
Design the shopping experience journey and wireframes to build the Google Shopping Express Android app.
View project2010 Flipshare for Android
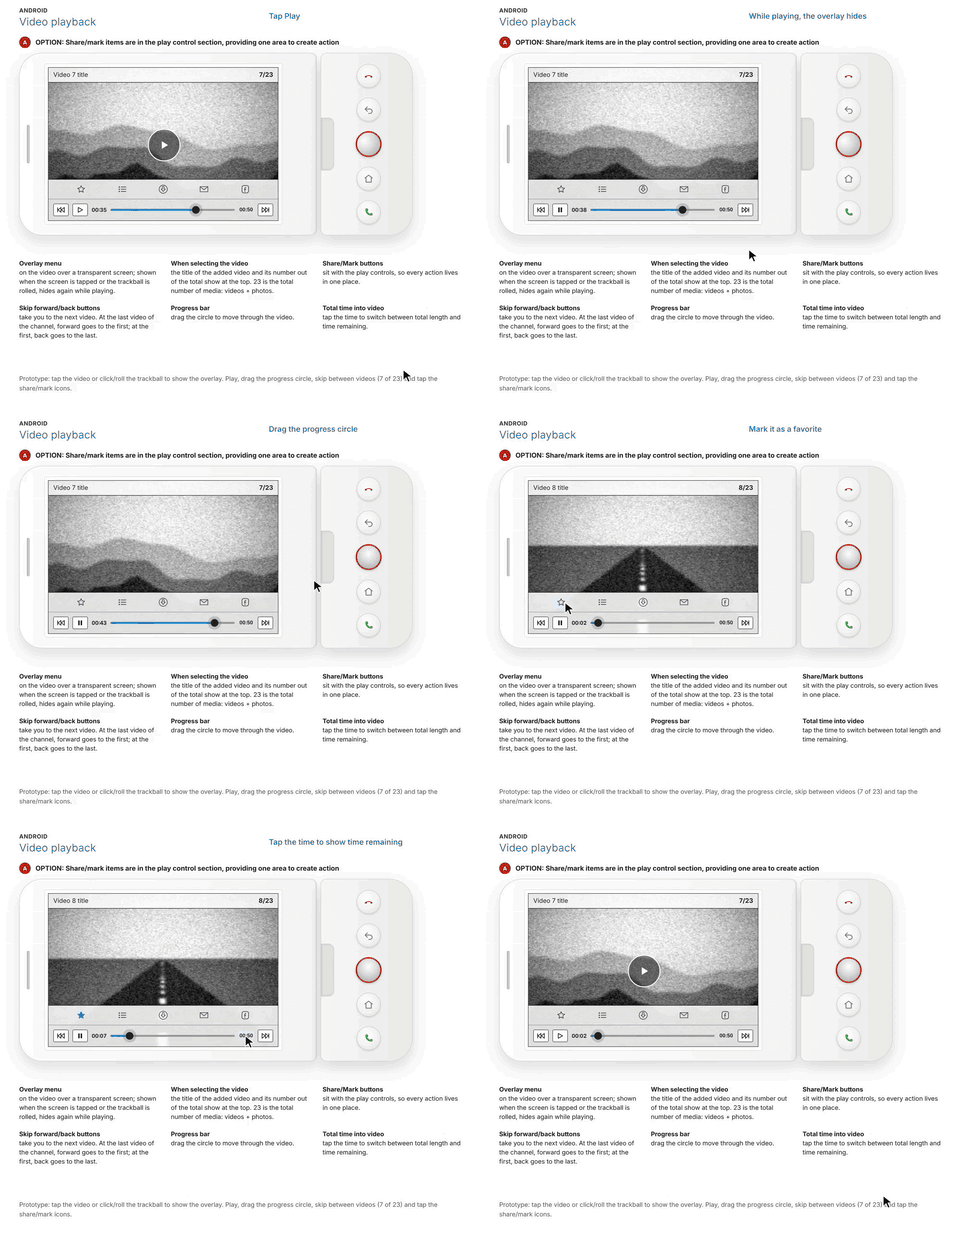
Develop a custom Android user interface for the Flipshare platform.
View project2009 San Francisco Panorama
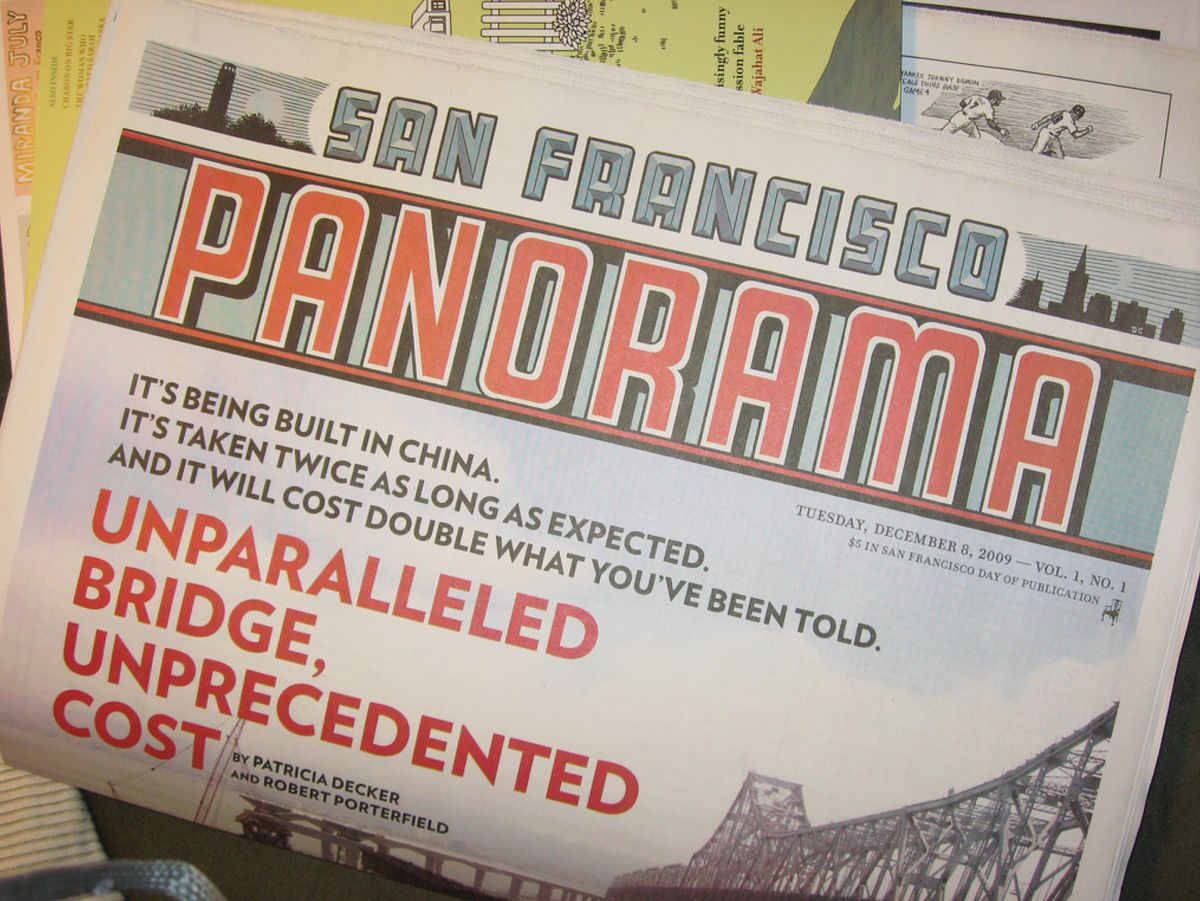
Illustrating a real-estate exposé for McSweeney's Panorama, a limited edition newspaper.
View project2008 3rst for Merchandise Mart Identity

A modular logo built from the letters of the name.
Develop a logo concept in which blocks represent the letters of the company name, conveying the company's modularity.
View project2007 – 2008 Healthcare Software Documentation
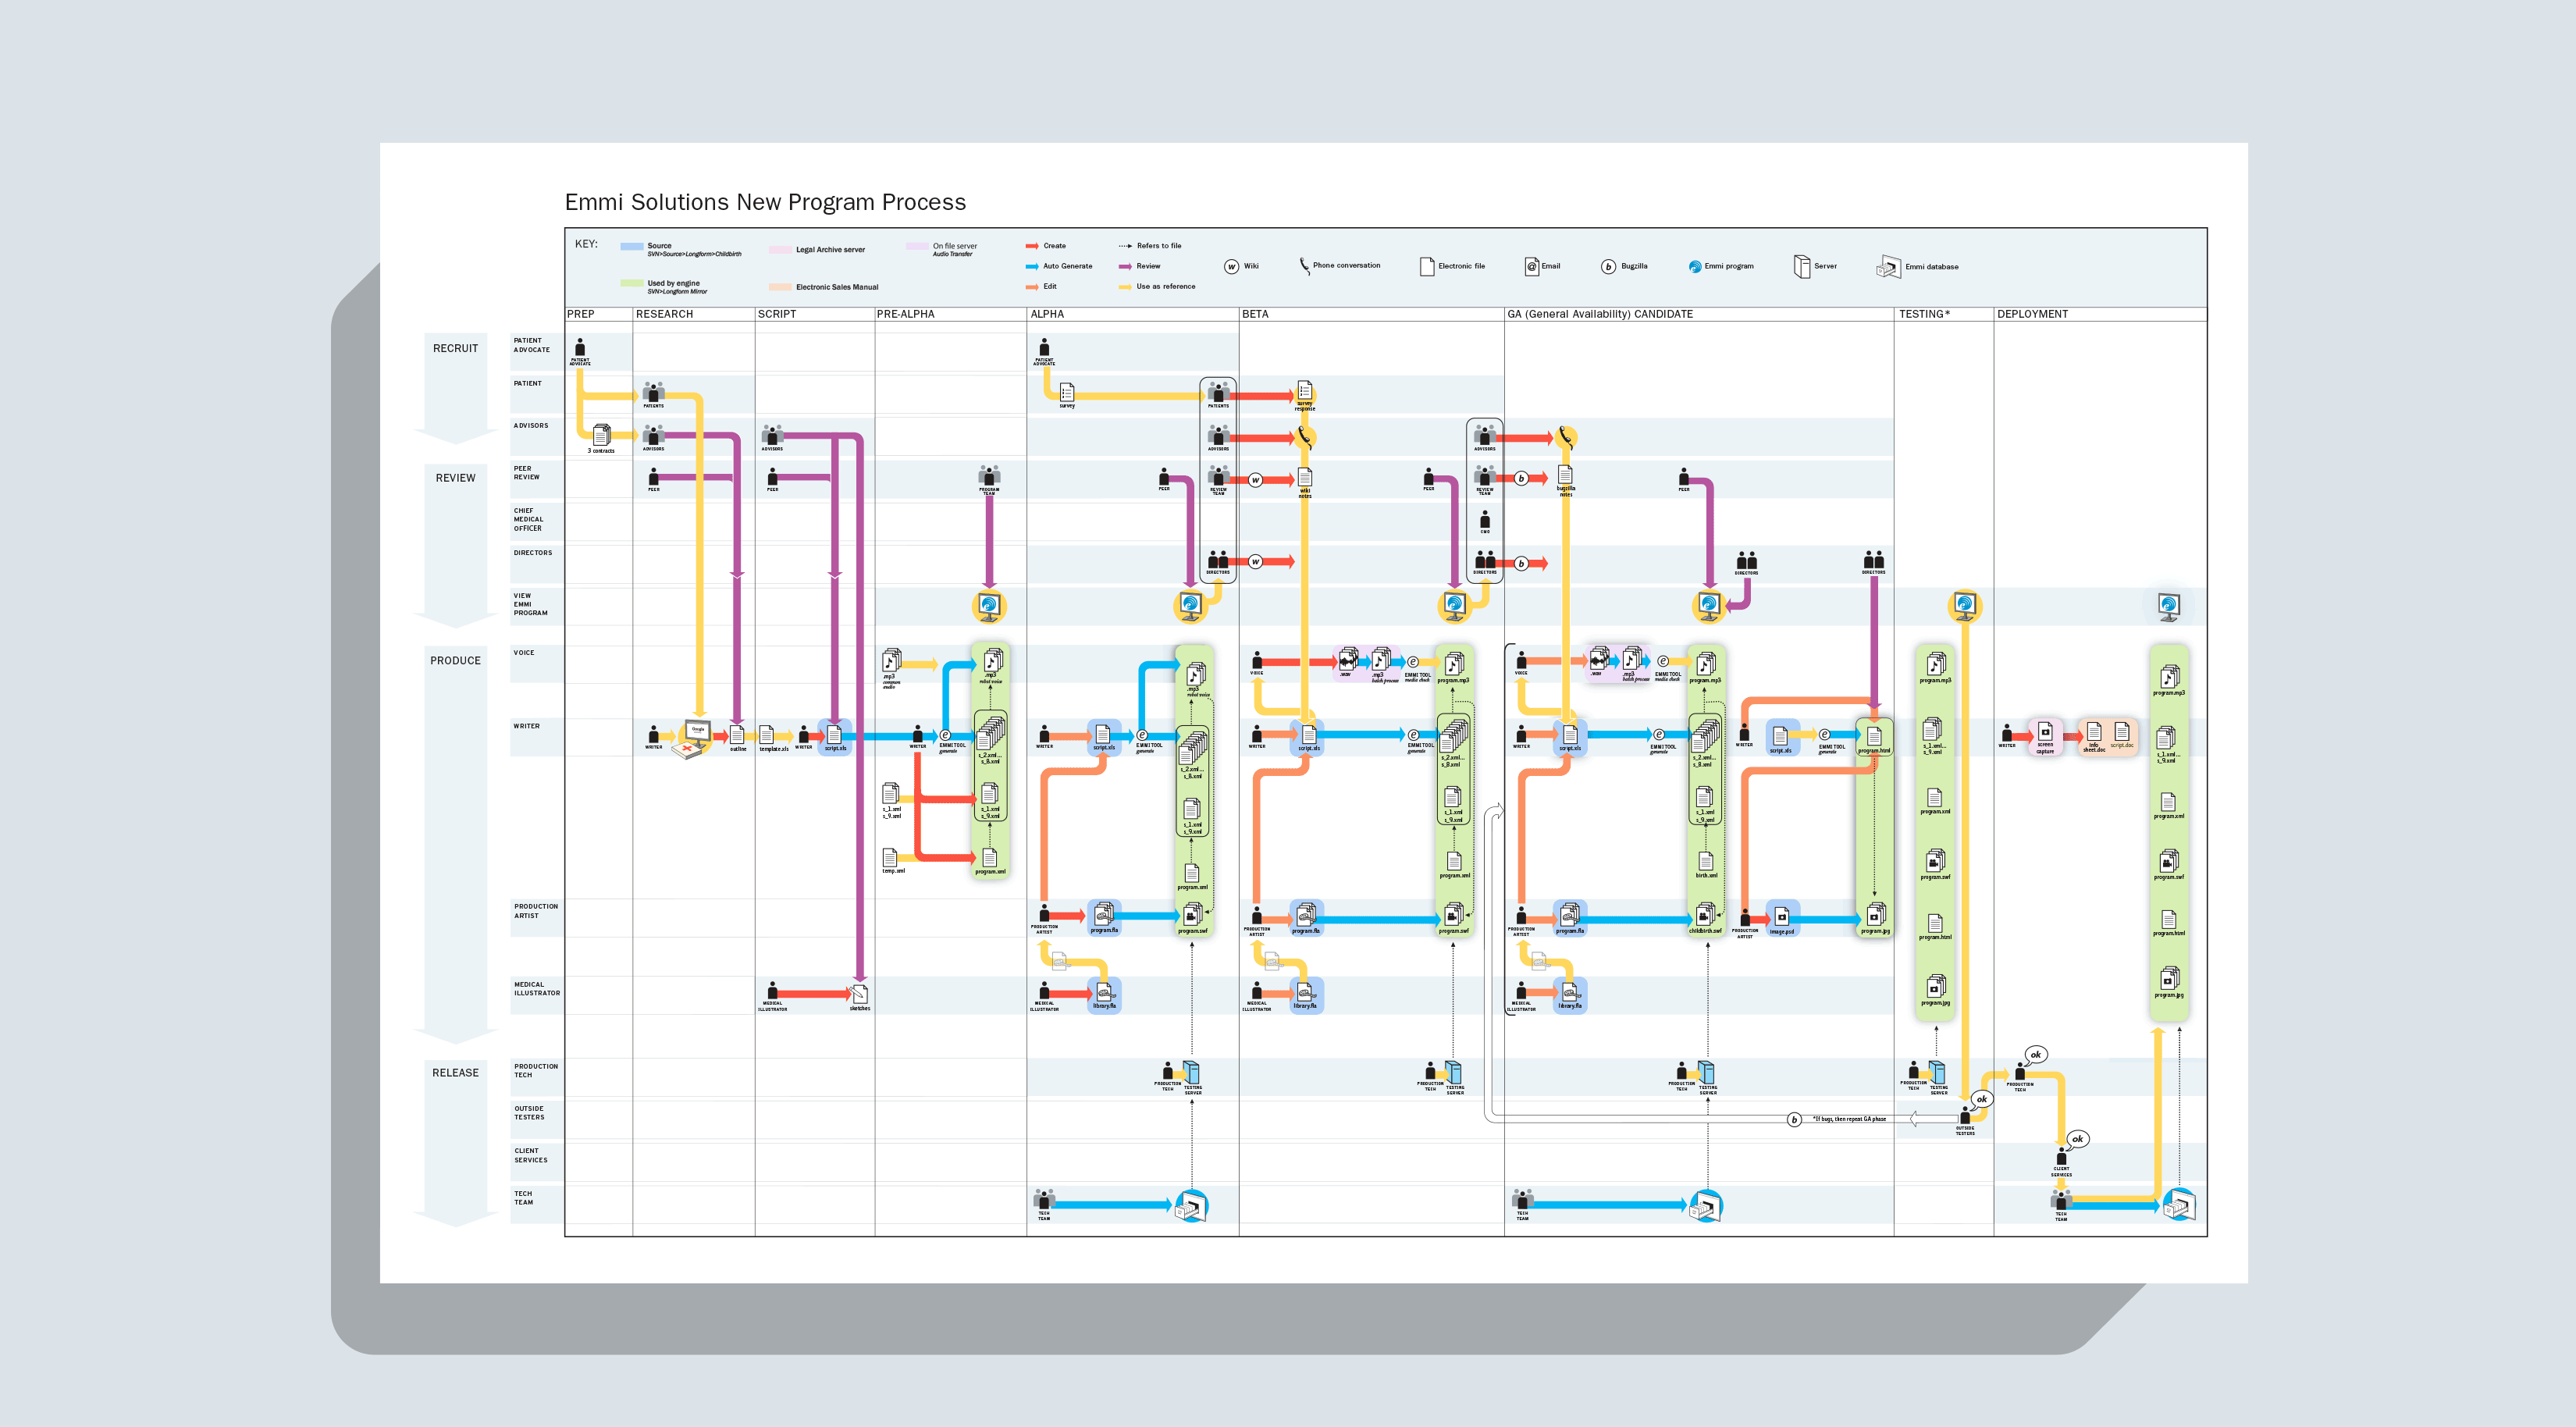
Mapping how a healthcare software program gets made.
View project2007 Darwill Breezeway Visual Explanation
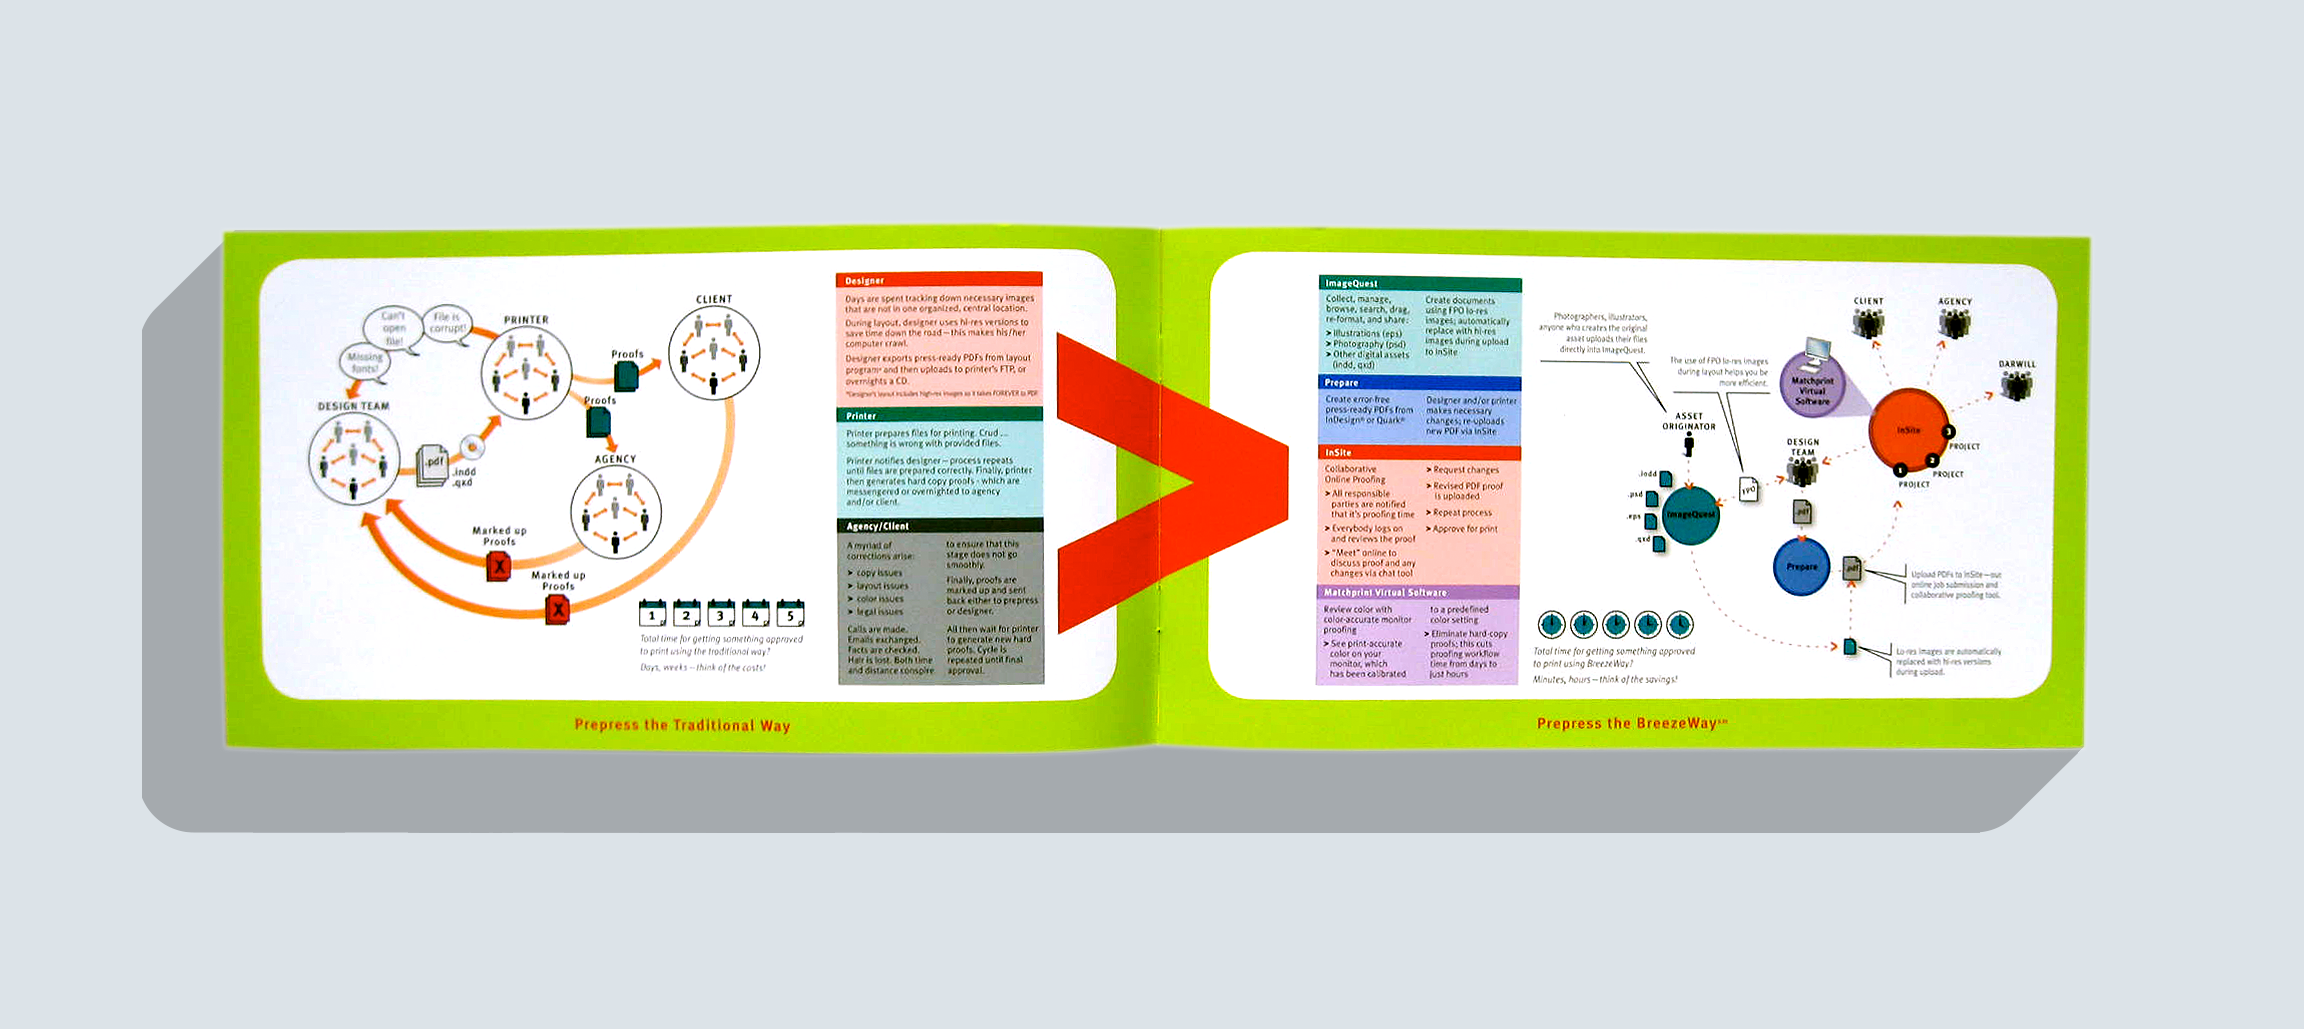
Explaining Darwill's prepress process in six steps.
View project2007 The Deep Book Microsite
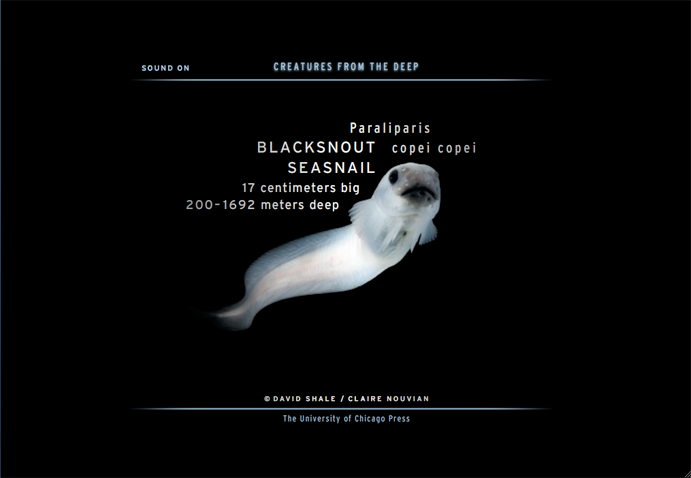
Bringing deep-sea creatures to life online by designing a microsite to market a book.
View project2004-2007 Visual Journalist
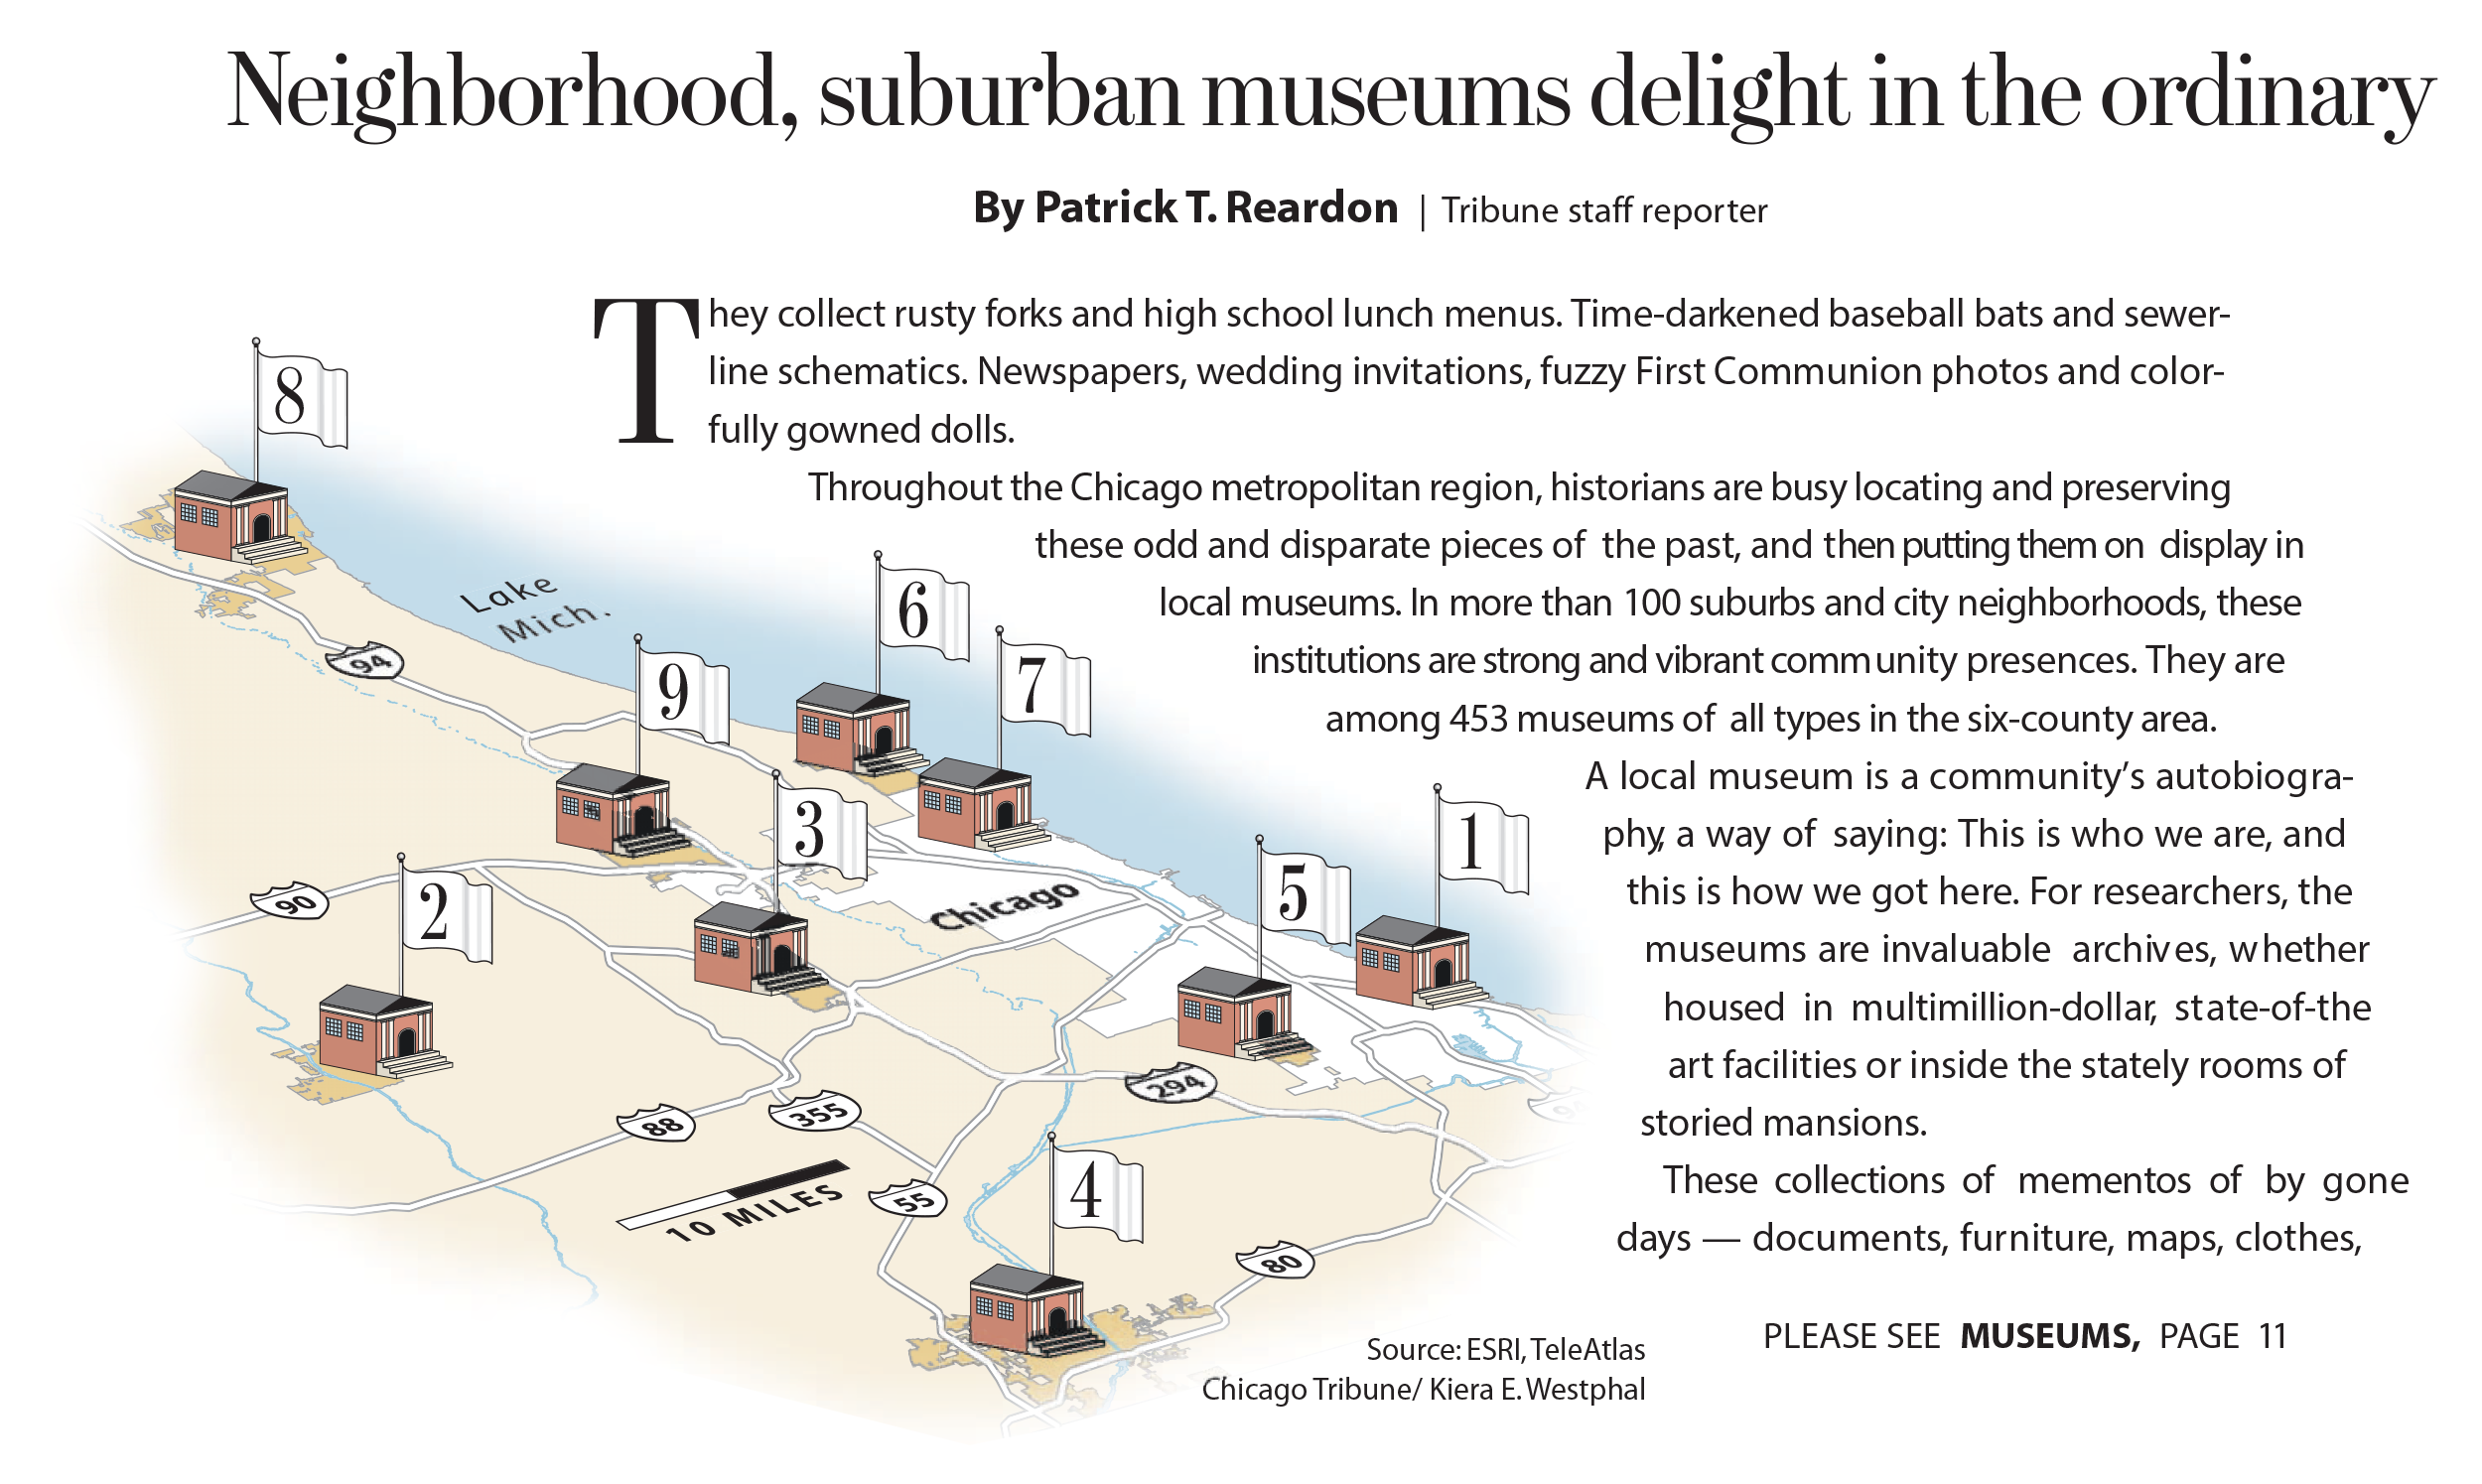
Built explanatory visualizations daily and early interactive graphics in Flash, connecting the print paper and the ChicagoTribune.com.
View project