UserTesting Competitive Benchmarking
A visual way for executives to compare their product's UX against their competitors' over time.
At a glance
- Company
UserTesting.com
2017
- Role
UX and Data Visualization Design Lead
- Team
A data scientist, a researcher, and a product manager.
- Responsibilities
Data analysis, led critique sessions, and delivered mockups.
- Goal
Let customers compare their services with others.
- Outcome
Displayed research data as an interactive experience. Previously based in print, as a storytelling visual description of different business areas.
Competitive benchmarking was a research area that User Testing would send to clients as a file they could review to see how their company compared with others in their industry. Before I joined the team, the project had been in discovery for nine months, and they wanted a solution that would make the statistics visible for a first release. This project aimed to replace a static, linear report with an interactive tool that lets executives.
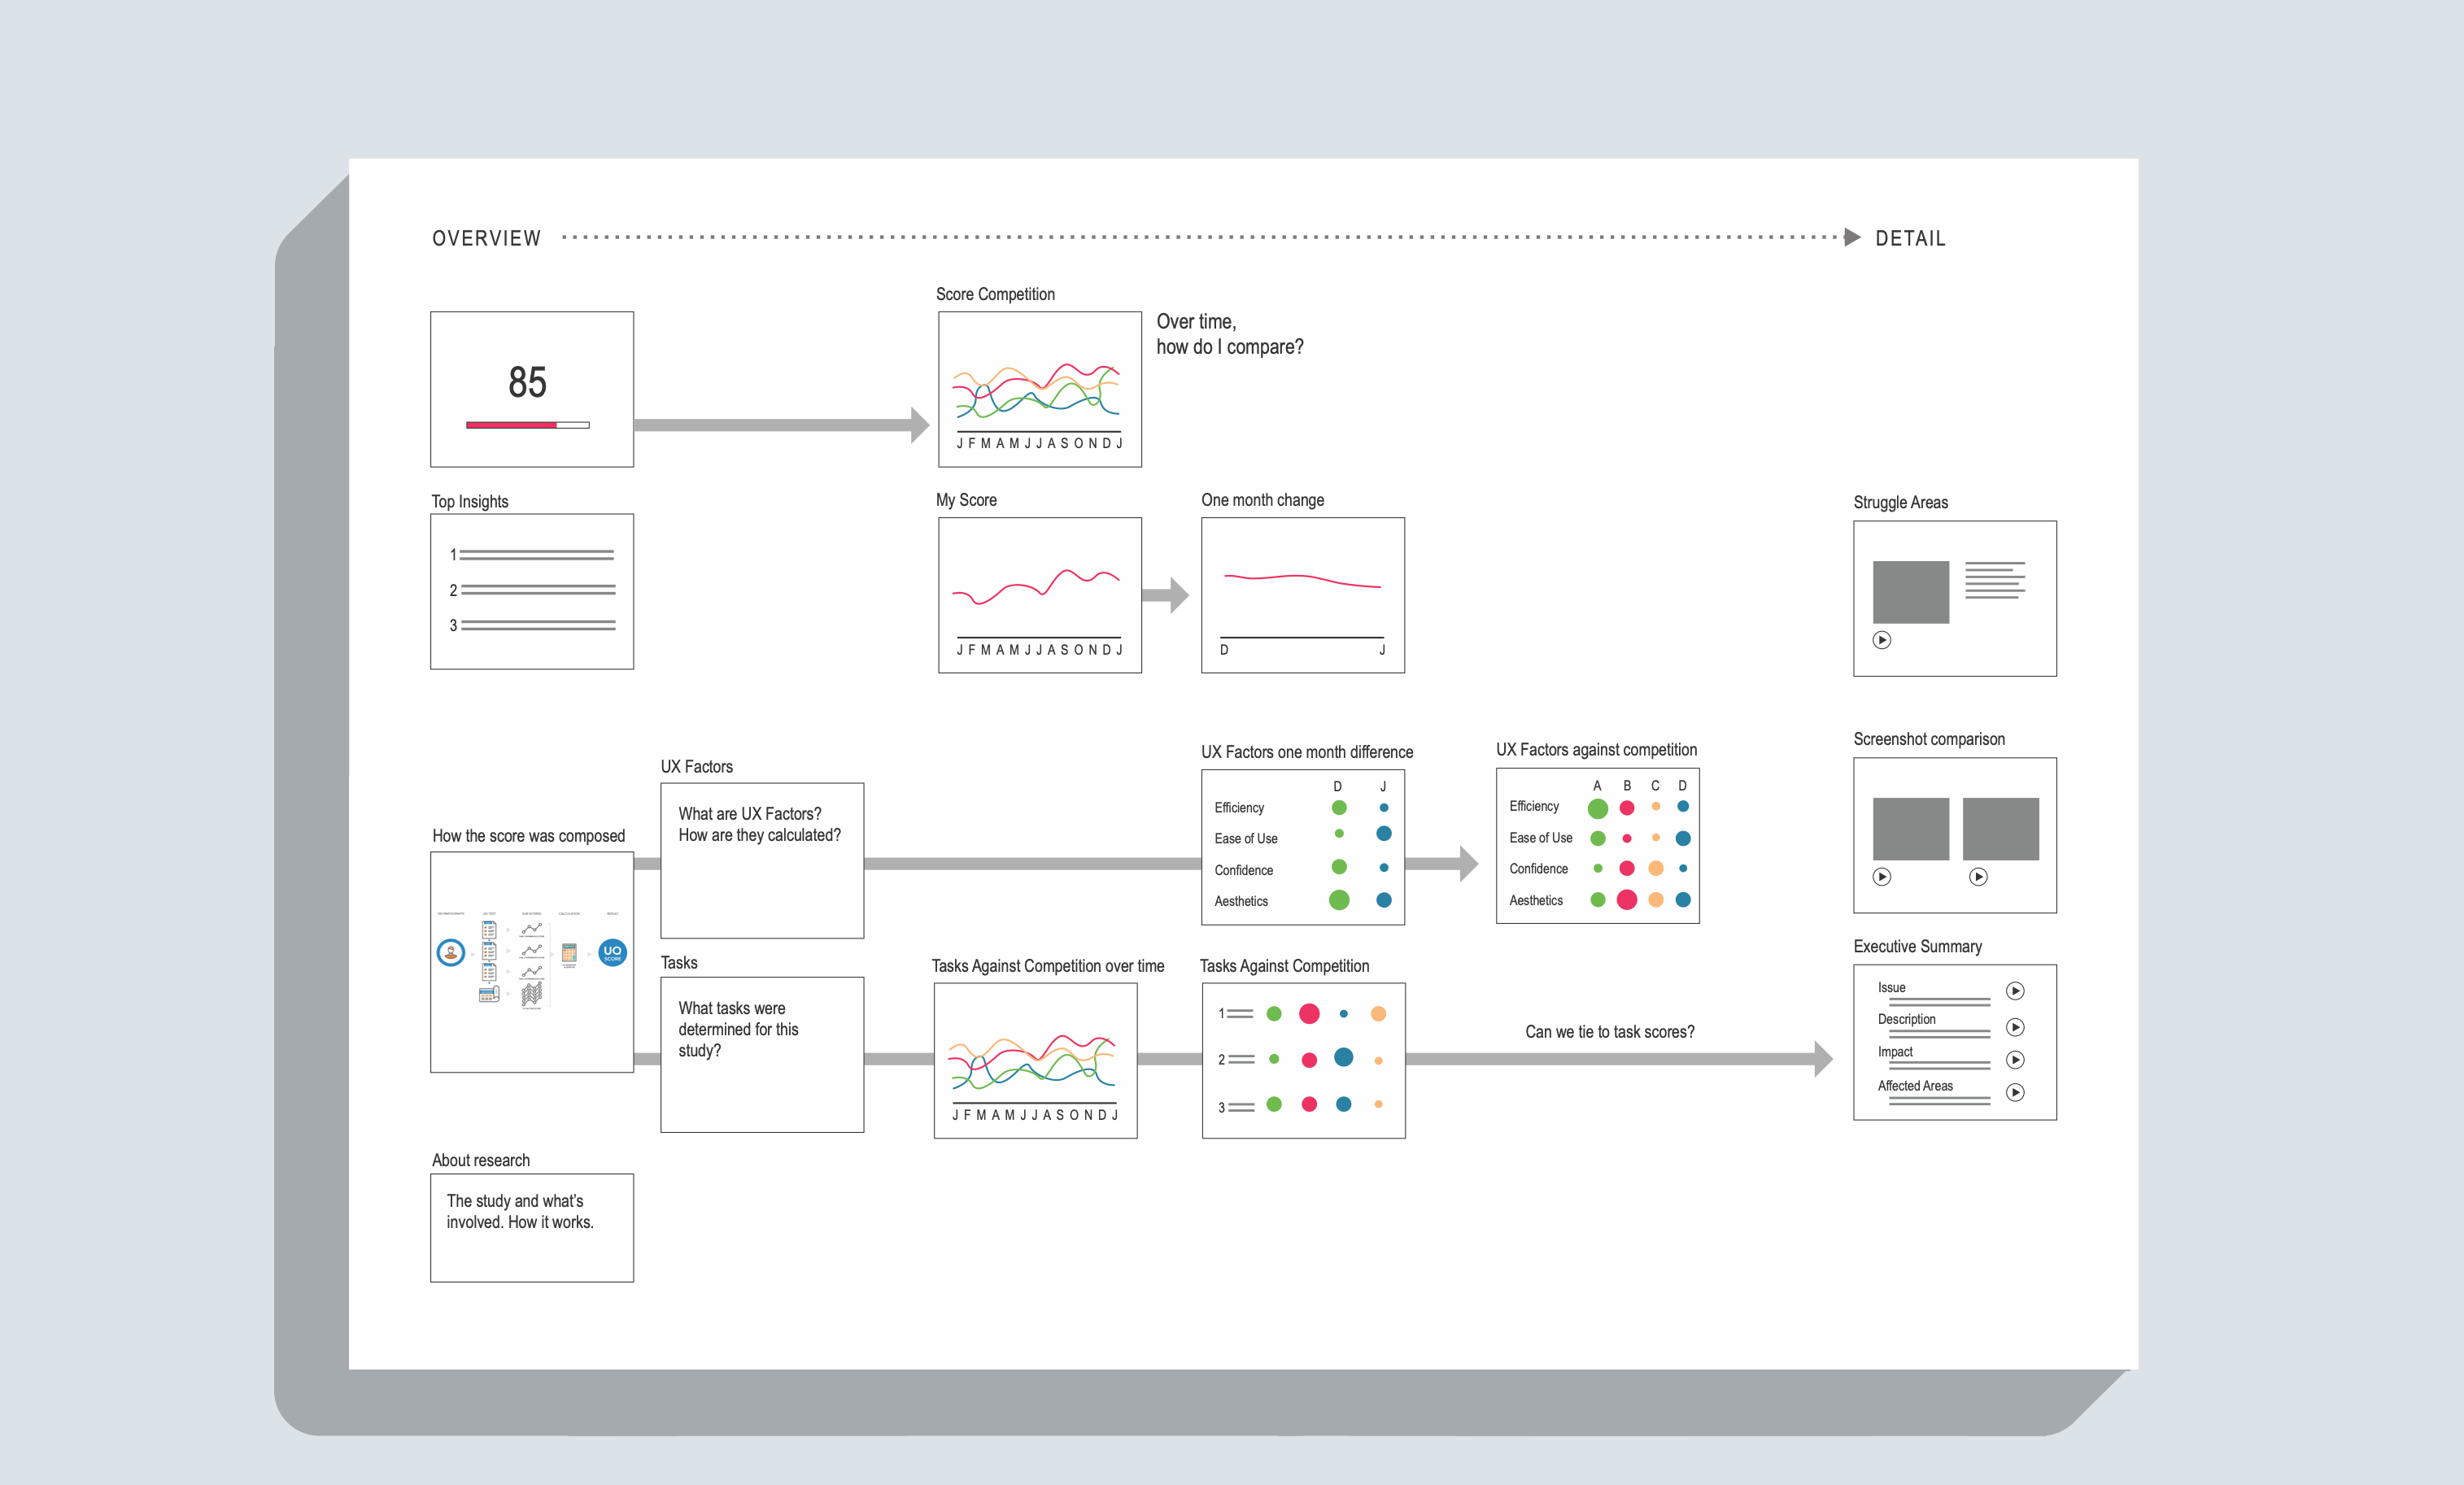
Analysis of the Existing Content
Previously, this project was print-based. Data scientists gathered data and presented competitive research to clients in a document they would email. I analyzed the data and built a diagram of research areas we could start with. I began with a happy path built with sample data.
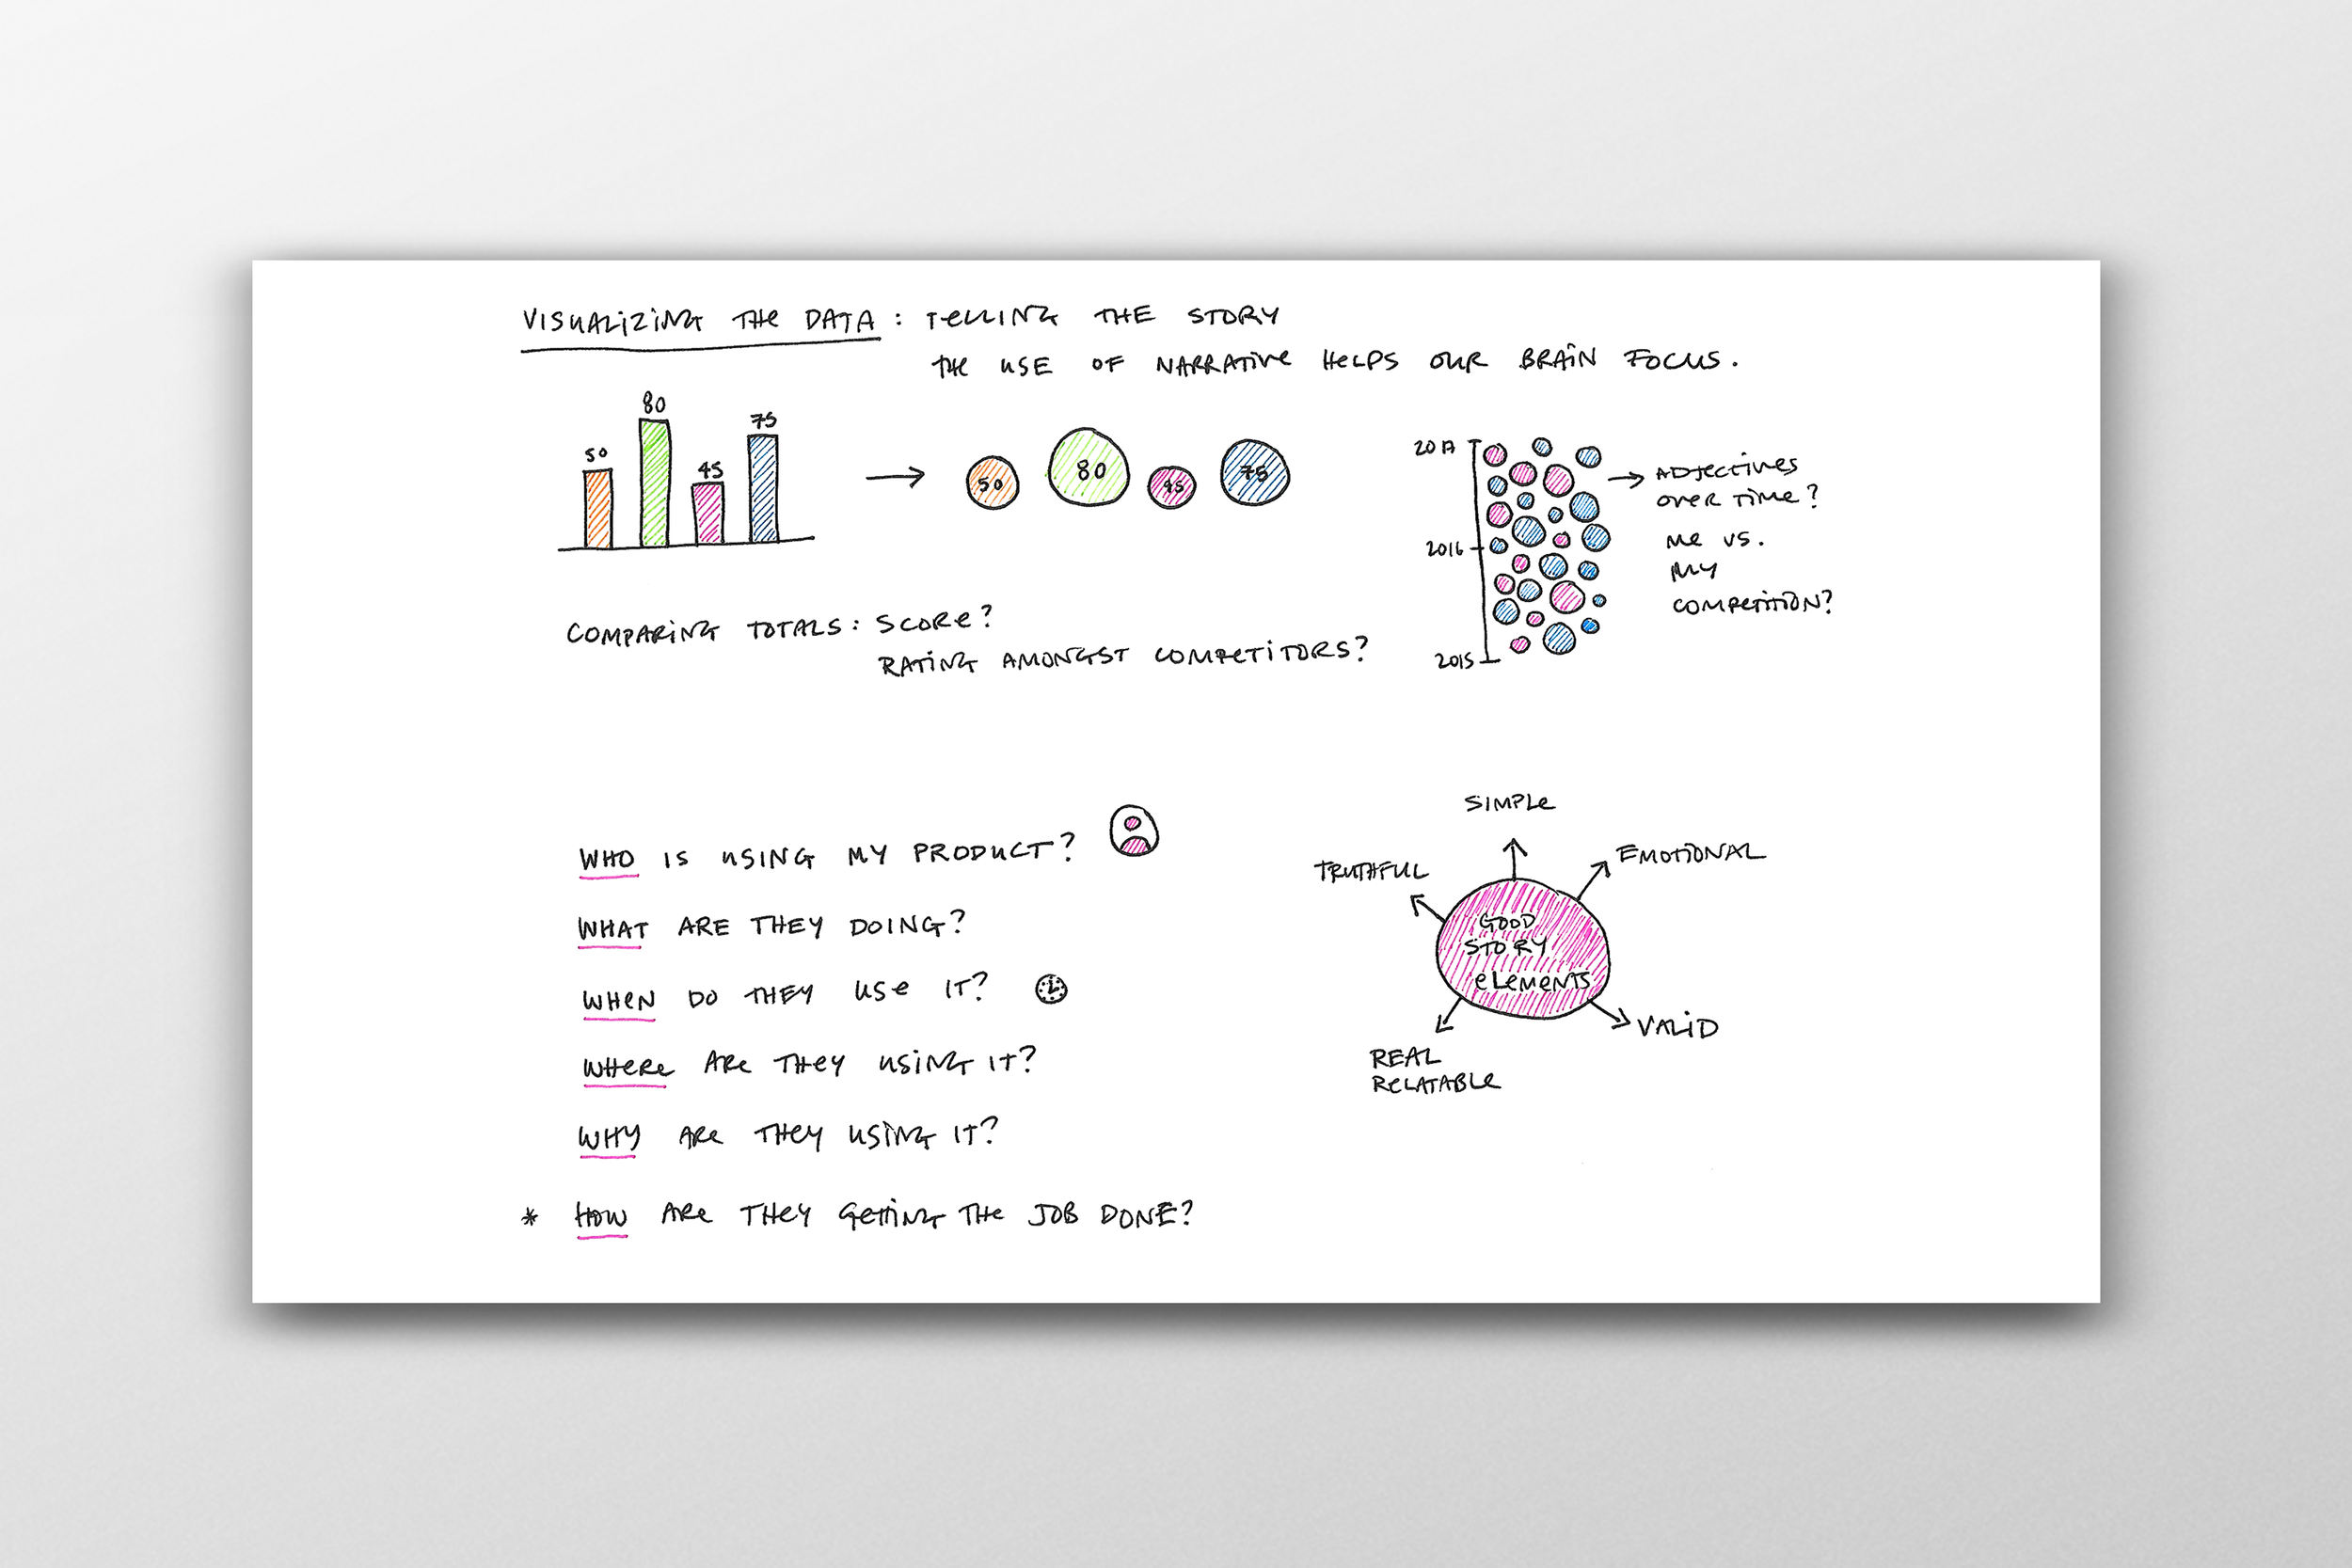
How might we translate a printed document to an interactive experience?
To achieve the outcome of what this product would look like, using interactive data visualization, I categorized the wireframes to show an overview, top insights, UX factors, tasks vs. competition, and struggle areas.
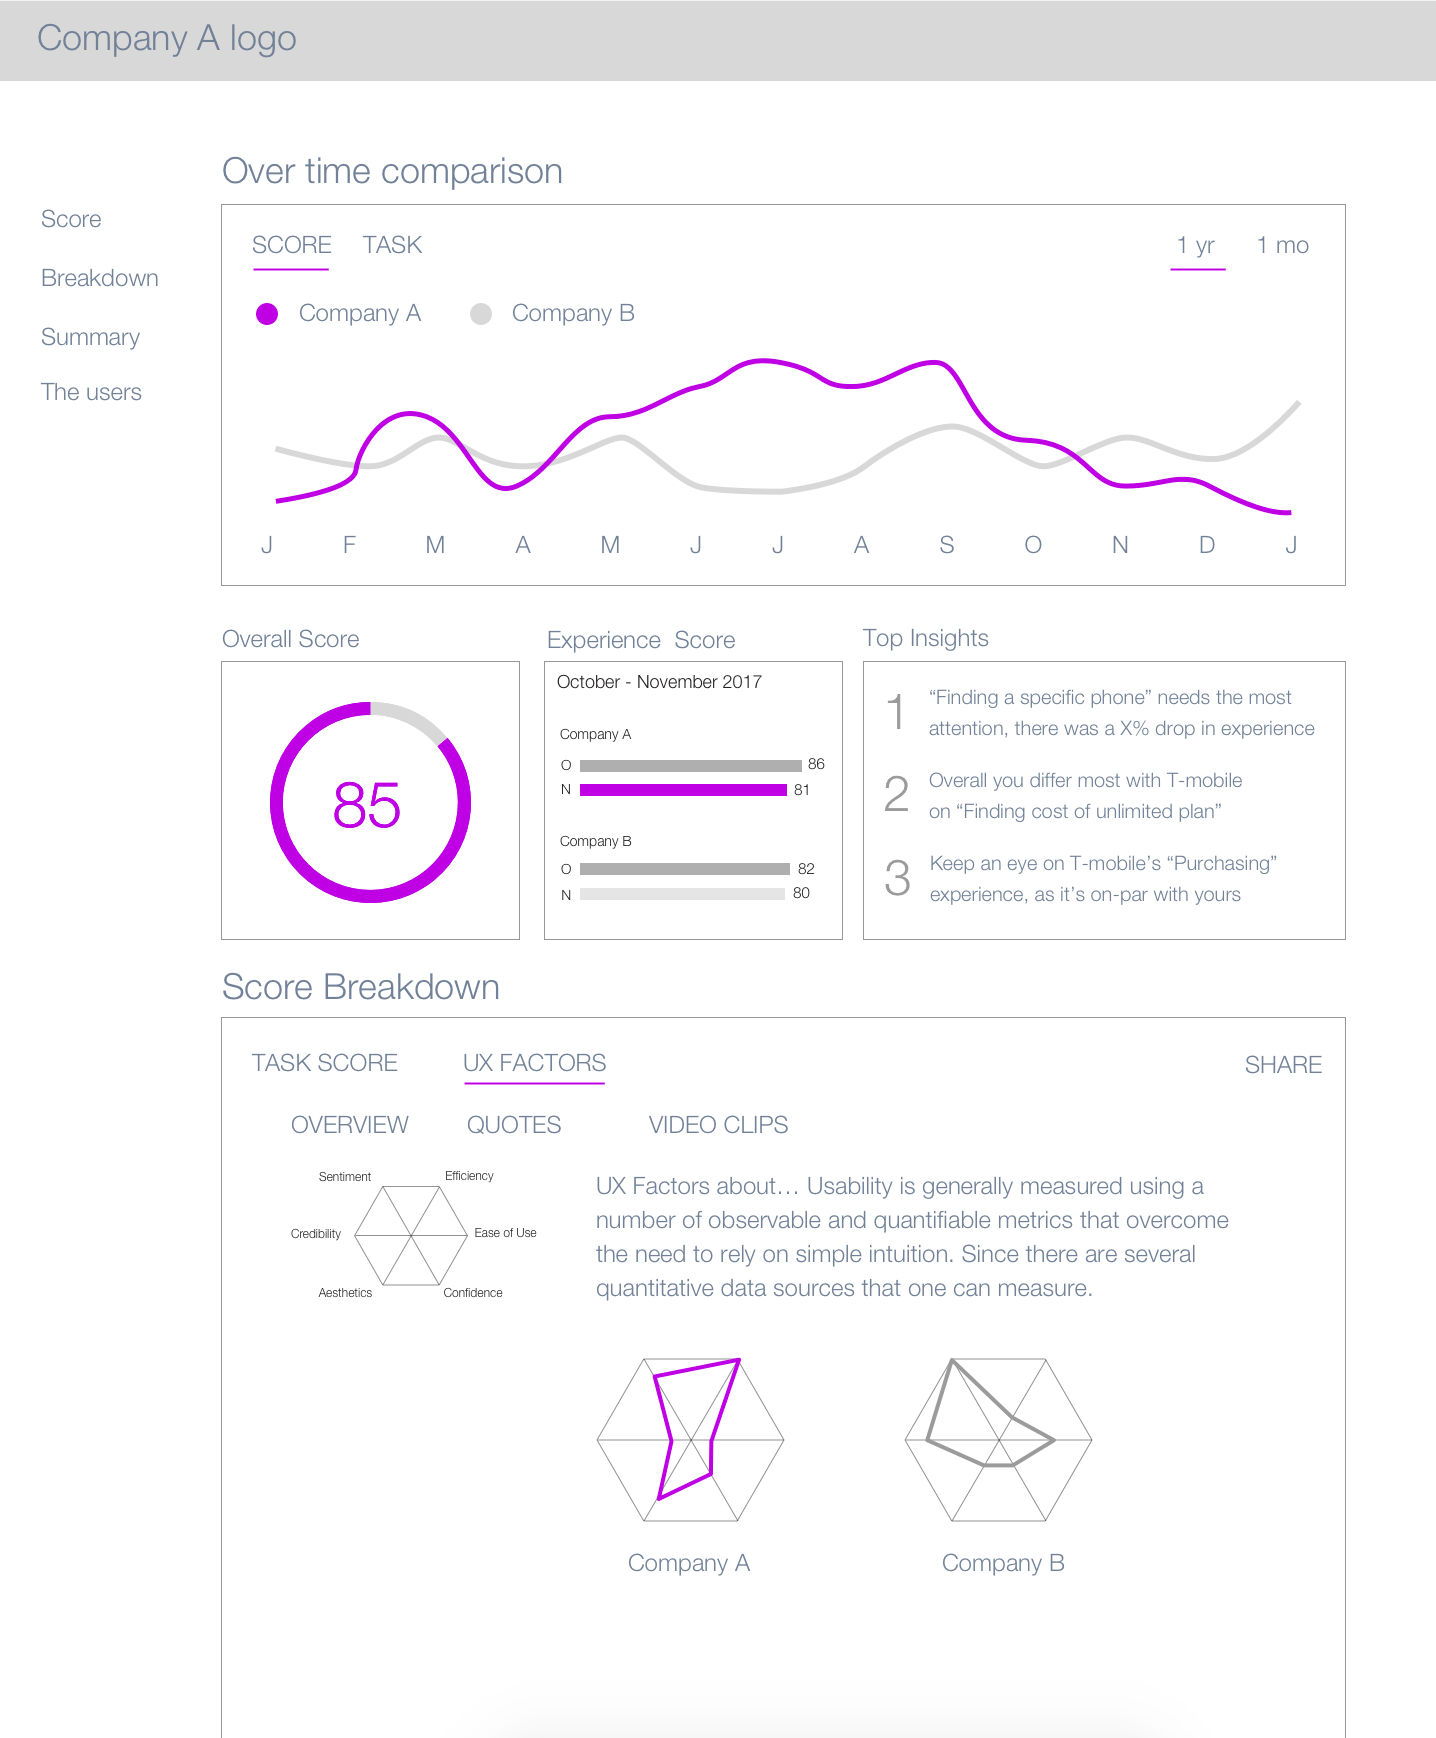
Gathering stakeholder Buy-in
As the designs took shape, I presented the work to the team and gained stakeholder support. Before I joined the company, the team was also pursuing a different tool.
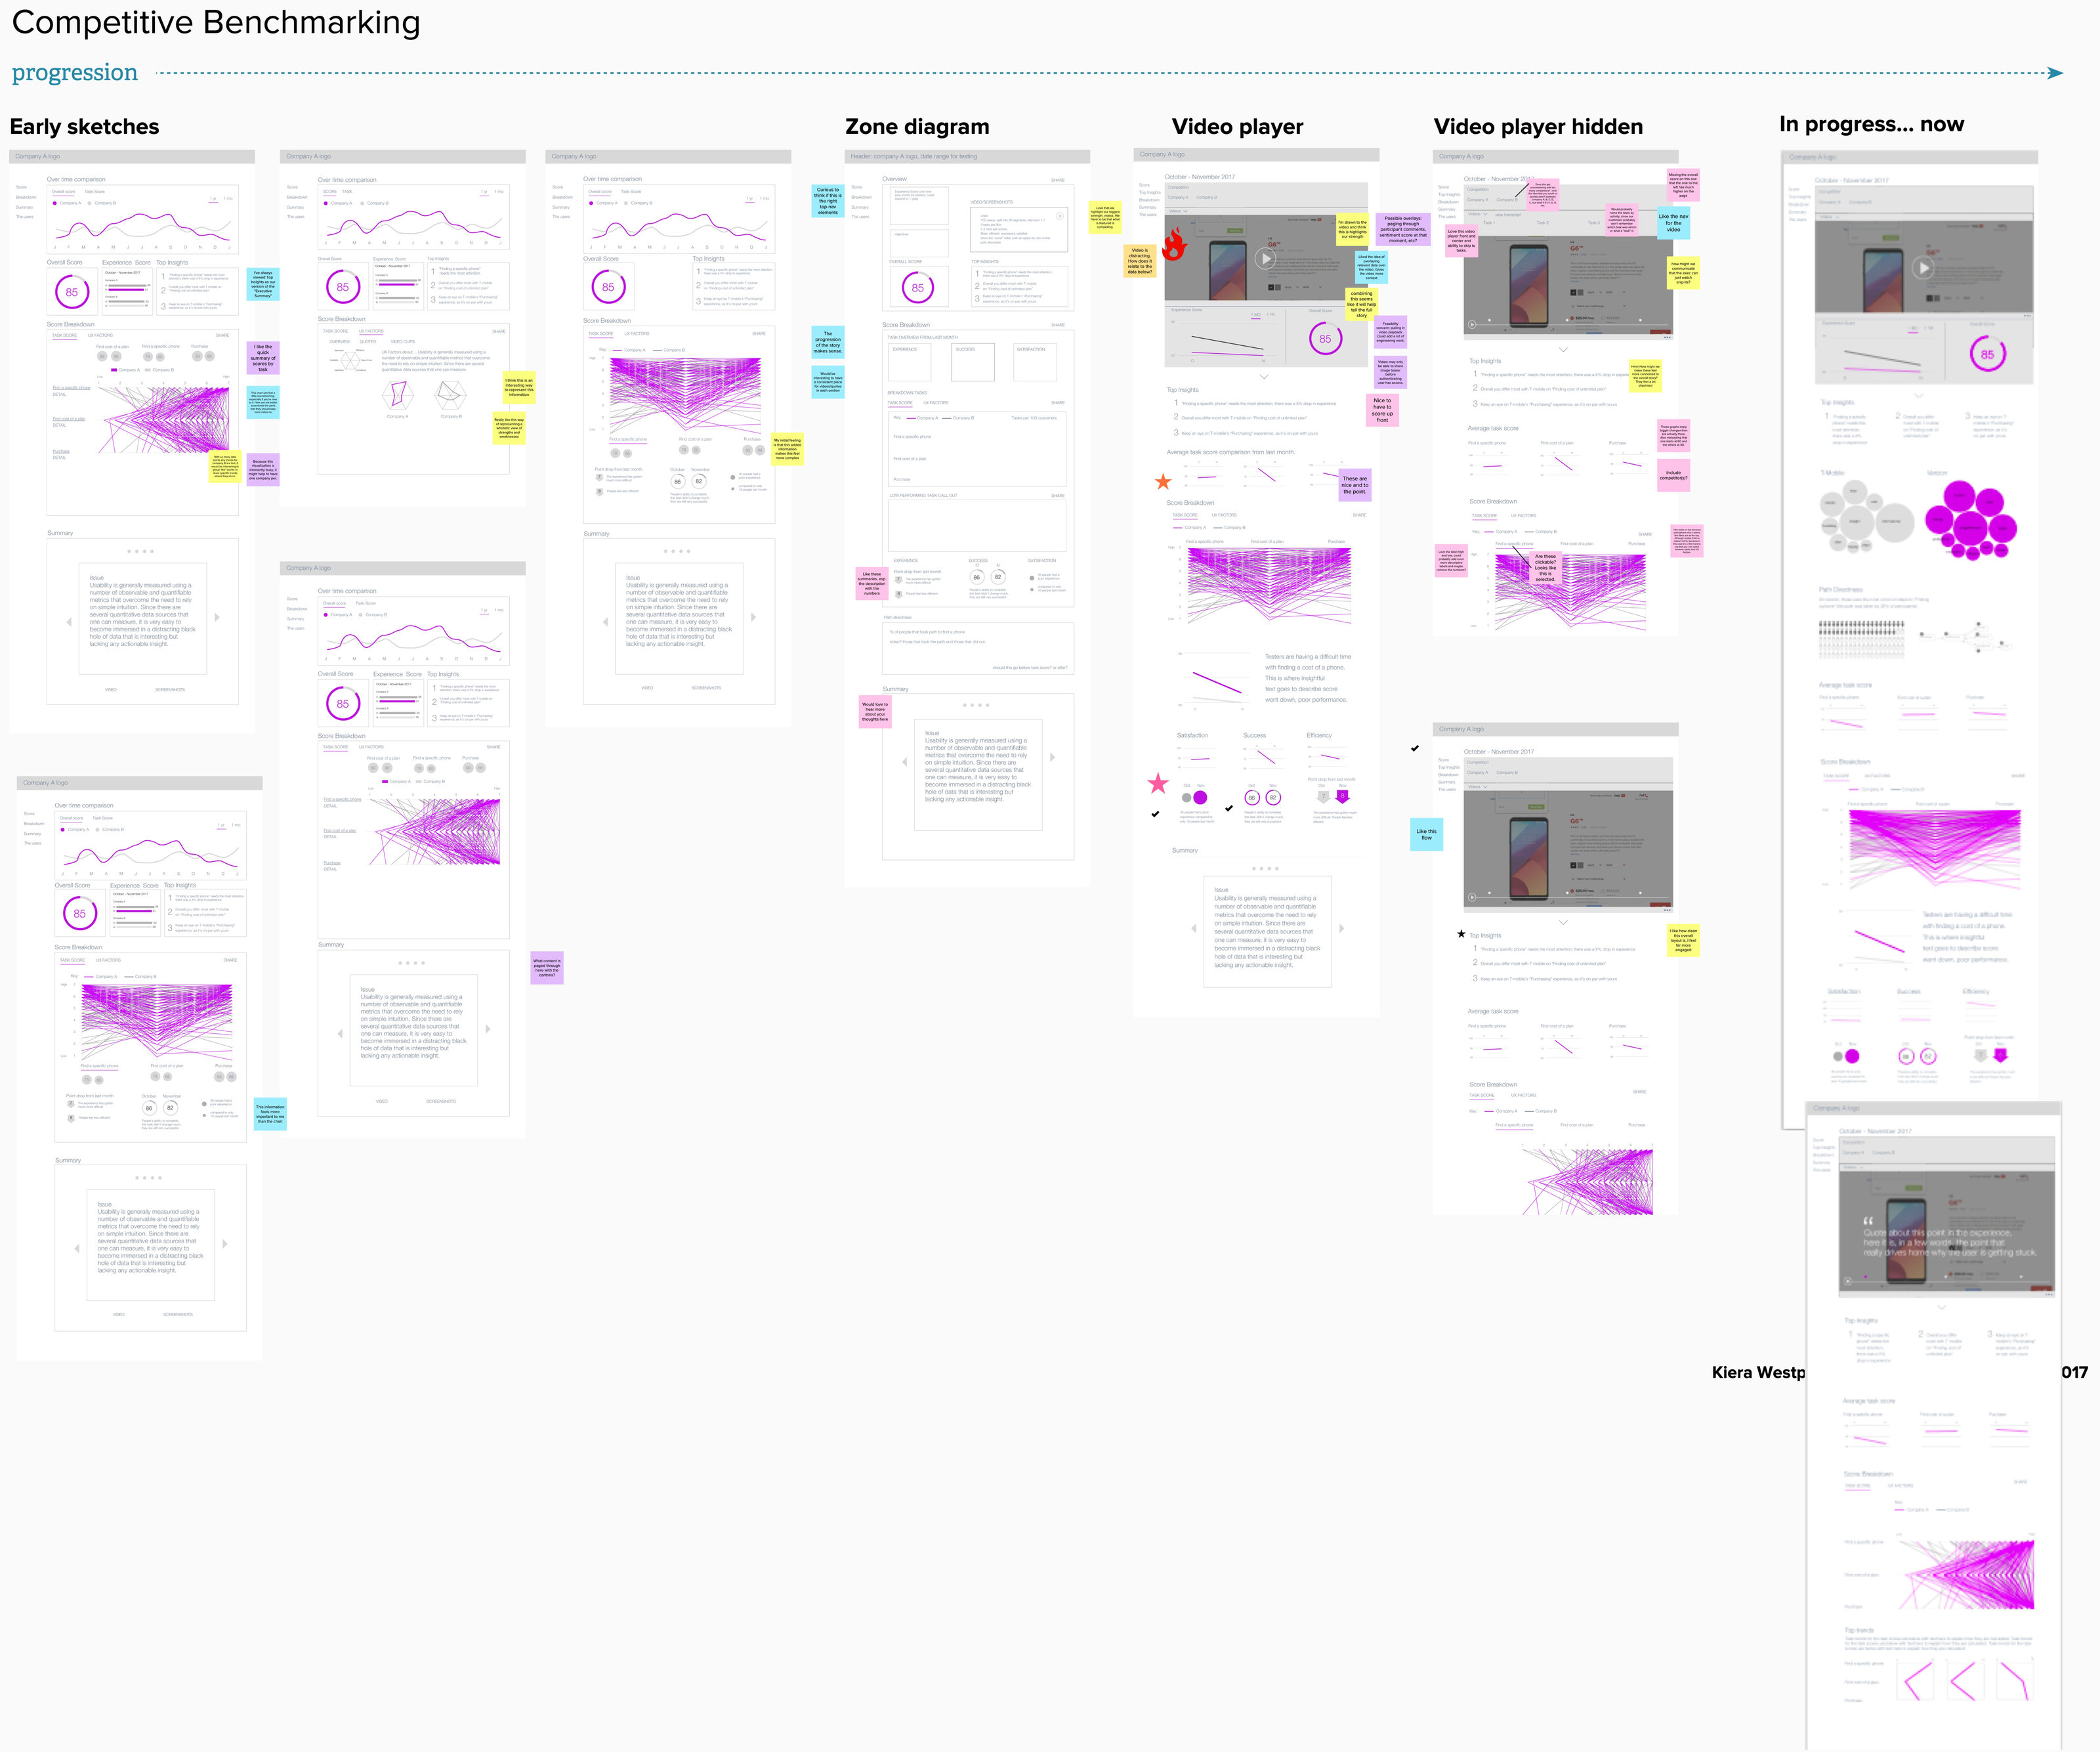
Balancing Data Literacy with Clarity
The team, although based in the Bay Area, was mainly spread out and we held meetings remotely. I created critiques using Miro, a whiteboarding confernce tool, to share my progress and gain feedback from the team.
Incorporating the Design System
Stakeholders stalled on the unfamiliar parallel coordinates diagram for the score breakdown. I explored a heat map as a visualization that was easier to grasp the understanding. To support further iterations, I held critiques with the design team to explore clearer representations. After gathering feedback, I presented the final designs and shared the vision for the new platform.
The Outcome
I created an interactive experience that moved the content from a printed document to a live web version. It let businesses compare themselves with competitors to see how they were performing in the competitive landscape.
Scoping the Vision from the Beginning
When I joined the team at User Testing after nine months of discovery, management had begun looking in a different direction. They ultimately decided to pivot. It was a thrill to bring data visualization skills to a talented team with a brand-new design system. I learned how crucial it is to have a design lead from the start to scope the vision.