Interactive Visualization Designer
Created interactive graphic displays to help Analysts visualize stories for the Goldman Sachs Research Portal.
At a glance
- Company
Goldman Sachs
2018
- Role
Interactive Visualization Designer
- Team
Managing directors and engineers
- Responsibilities
I worked on the visual design, interaction design, design system, and concept design.
- Goal
Create interactive visual stories for the Goldman Sachs research portal.
- Outcome
Several interactive scalable vector graphics were published to the research portal.
Goldman Sachs was committed to providing interactive graphics for Investment Research stories to add value to insights and analysis in the equity, fixed income, currency, and commodities markets. I joined the firm to build engaging interactive data stories for the research portal during a global pandemic. I consulted with Managing Directors across the department, then designed and developed several interactive graphics throughout the year.
Bringing Interactivity to Investment Research
The Core UX Team partnered with Global Investment Research but often lacked the bandwidth to create interactive graphics for the Firm. I began learning how they worked with Research and the capabilities of the CMS Platform behind the Research Portal.
Surfacing an Underdeveloped Craft
The small file format allowed us to work with the current CMS platform without long loading times. I rolled up my developer sleeves and occasionally leaned on a developer from the Core UX Team to churn out several Interactive Graphics over the year.
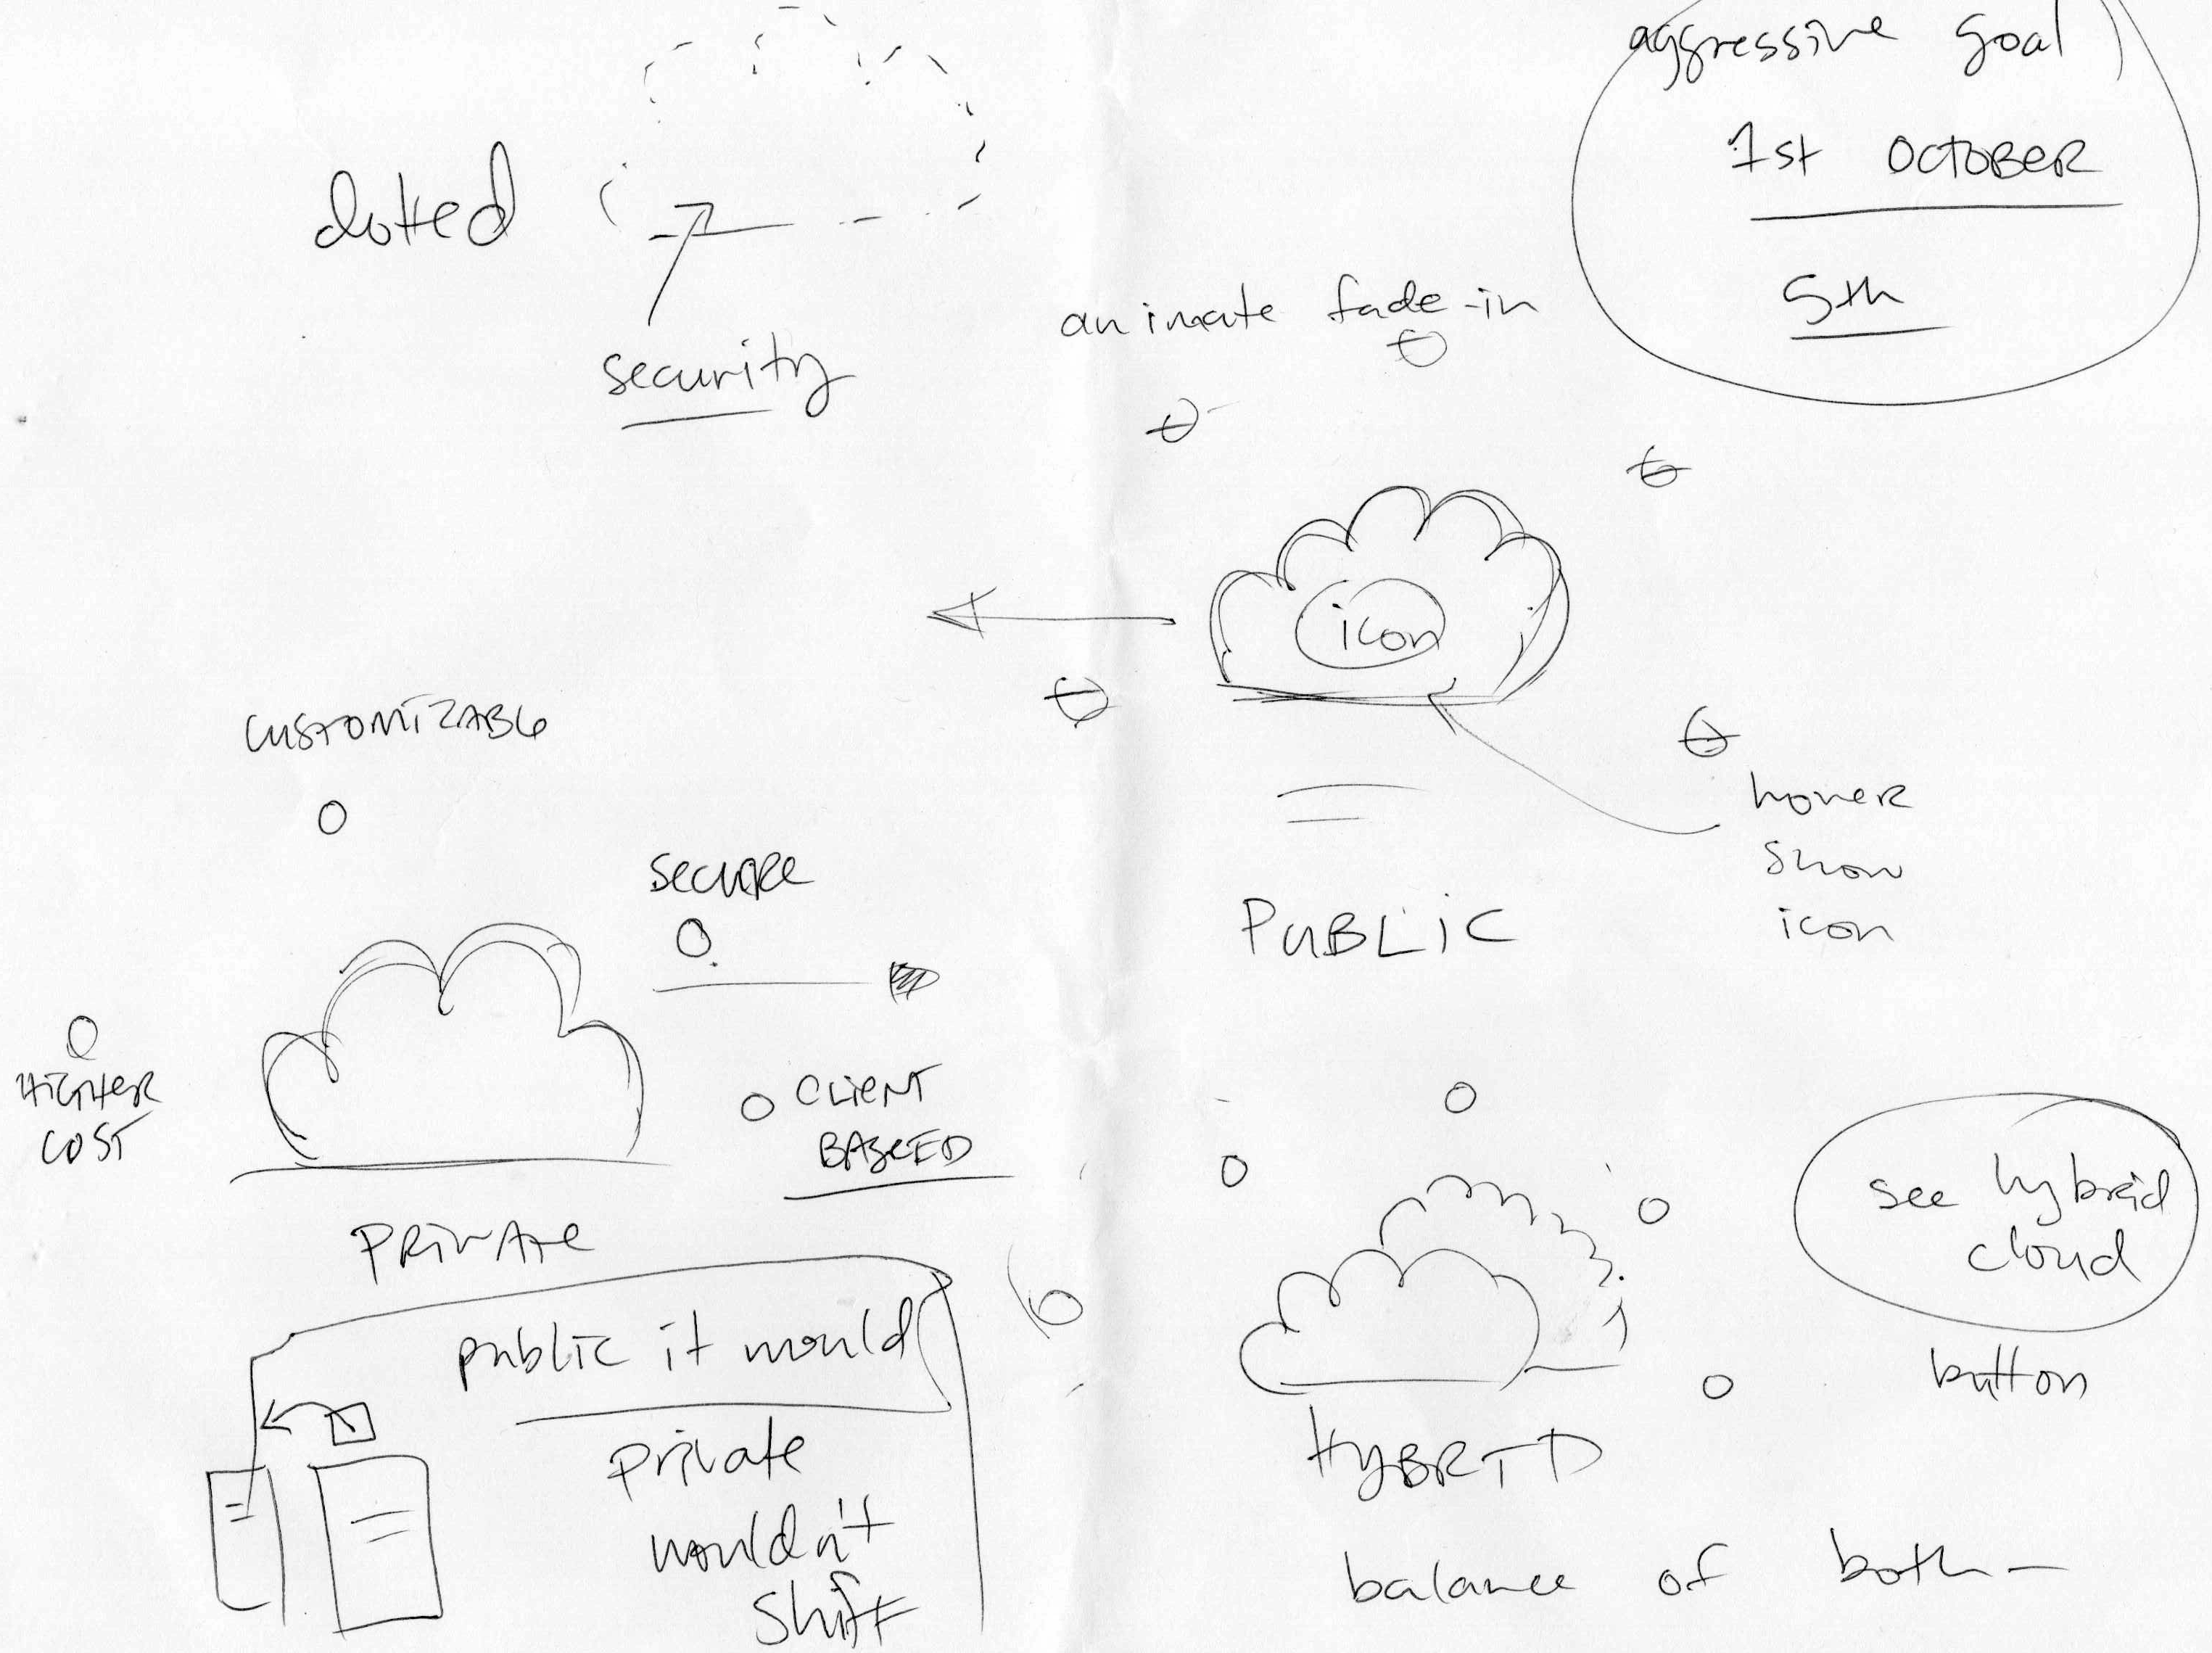
Ideating with Managing Directors
As I consulted with the firm's Managing Directors, I sketched as we collaborated and discussed the subject and visual possibilities. We partnered, exchanging ideas and arriving at a shared vision. Through this process, I drew on my independent contractor experience to drive the feedback loop and put on my visual journalist cap to estimate the design and development time we would need before we could publish.
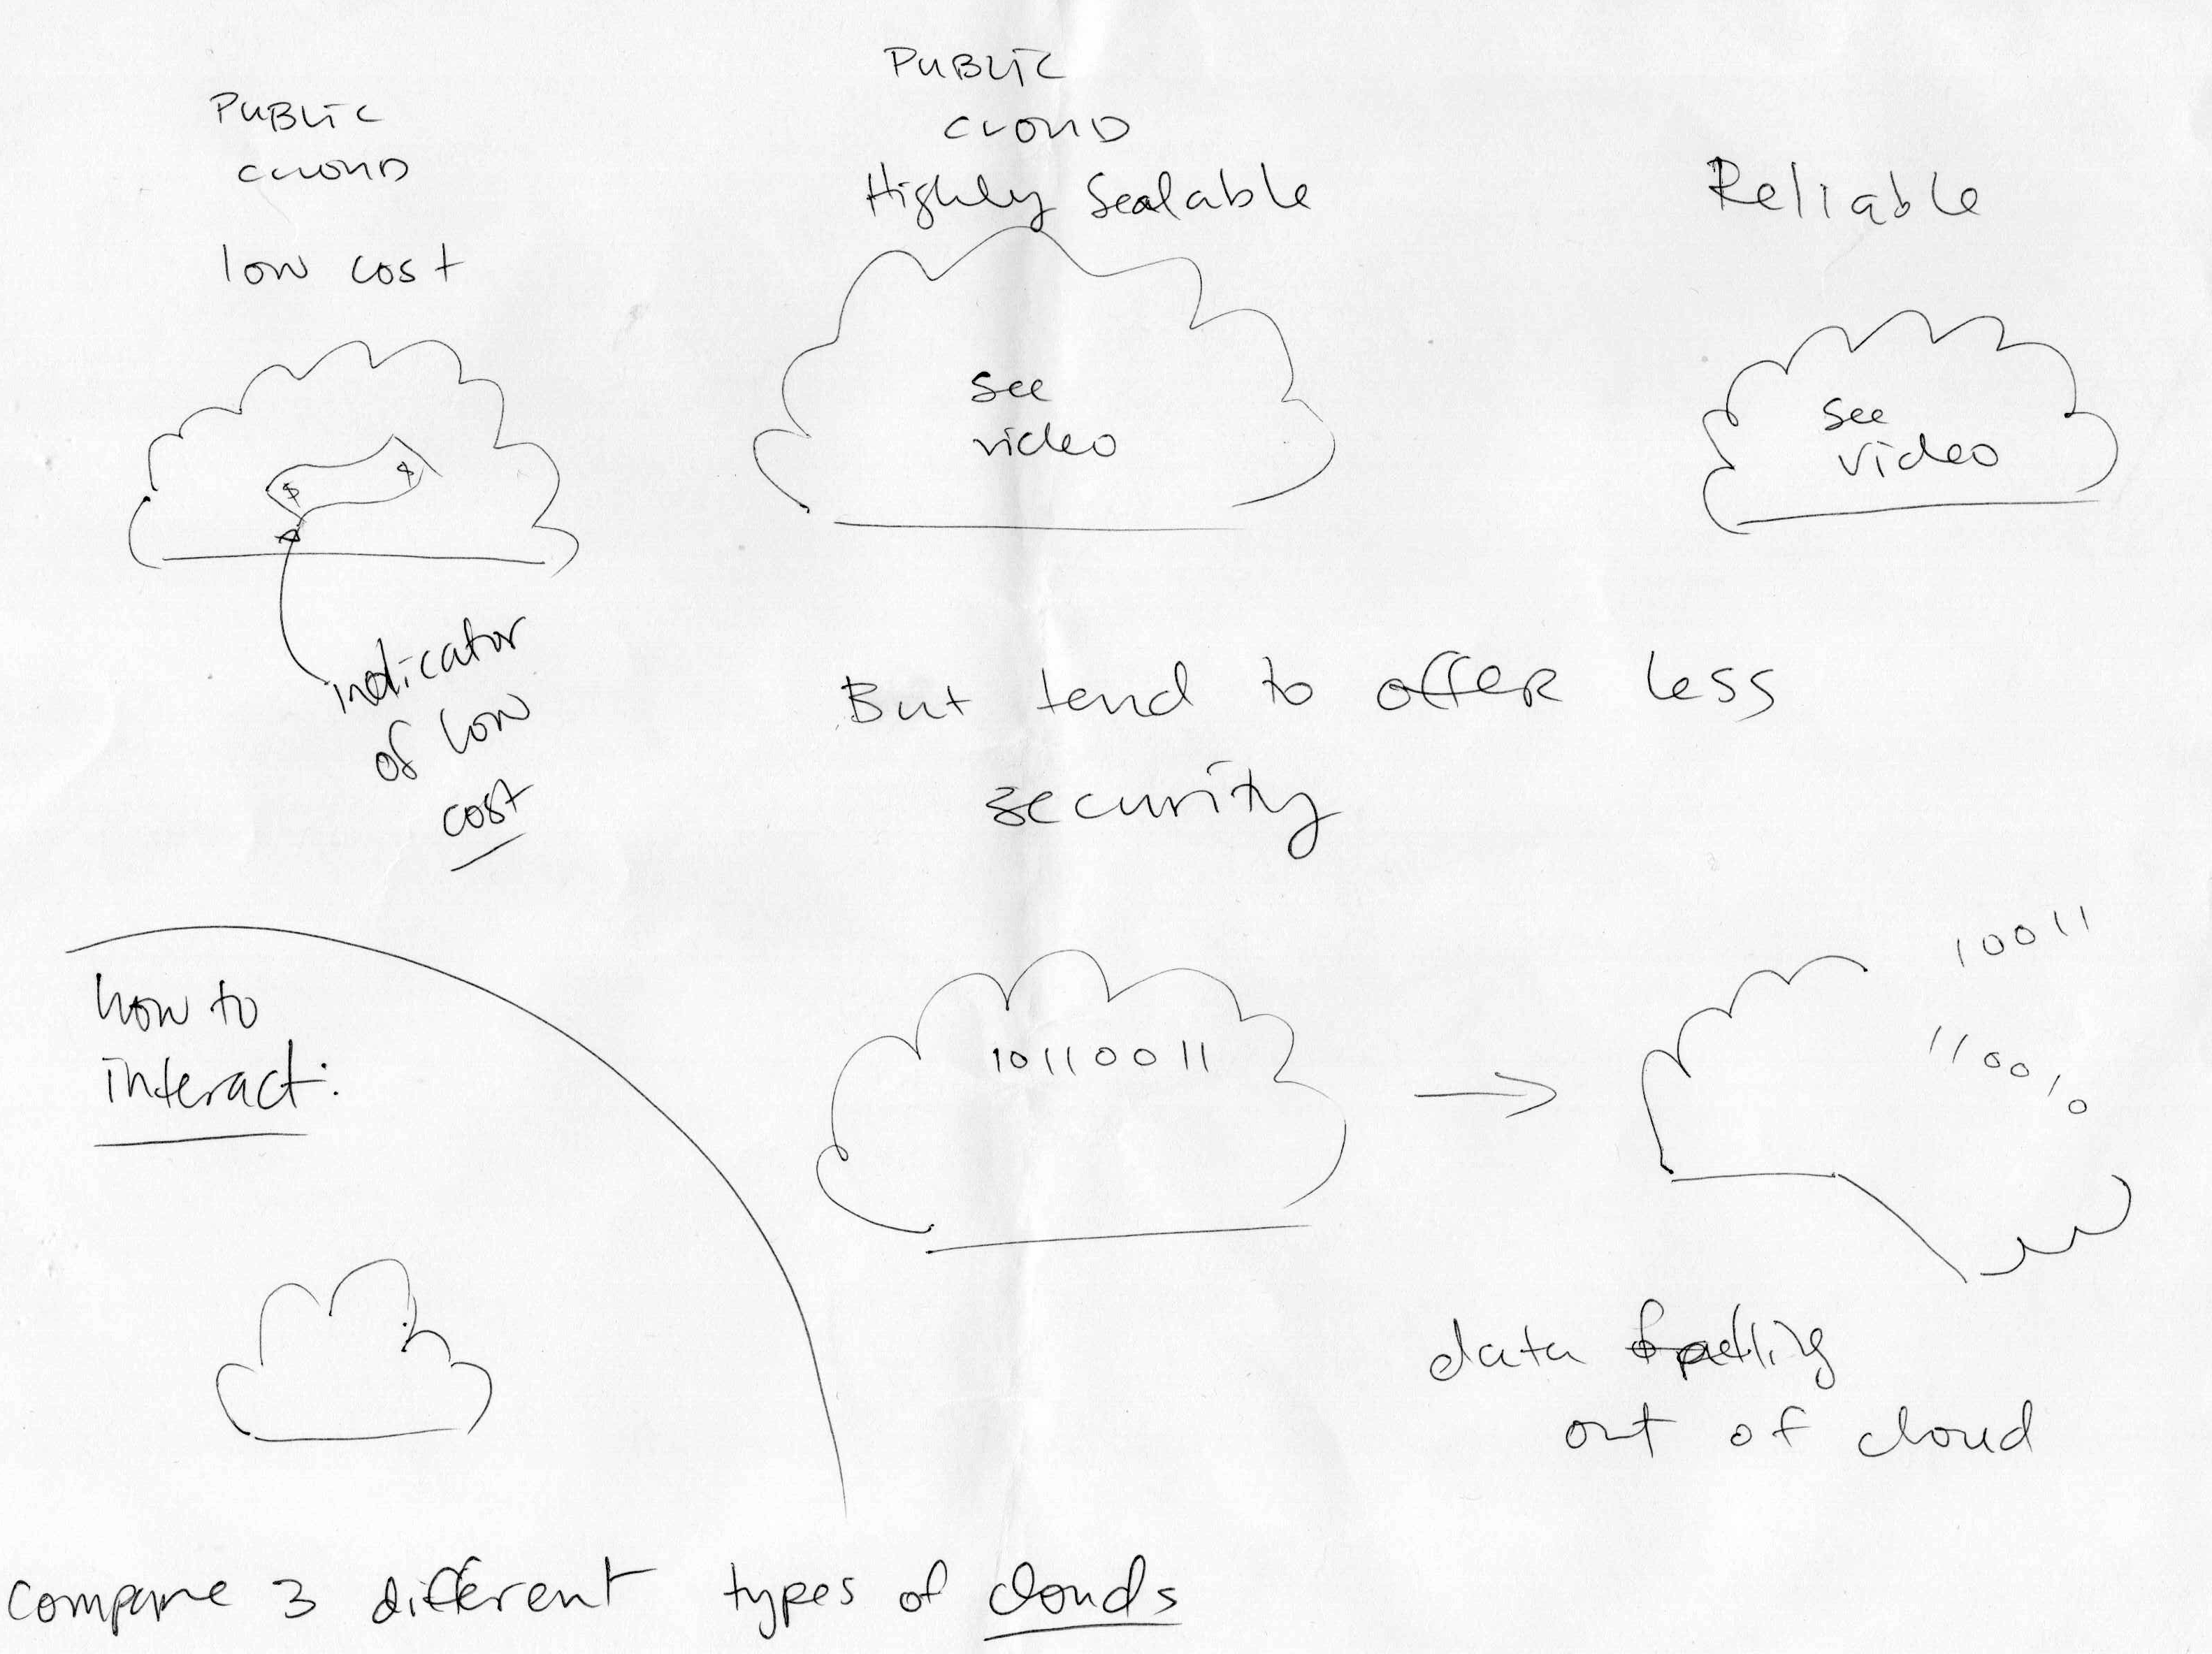
I enjoyed the autonomy to design and develop an interactive graphic independently after collaborating on the right direction. Goldman Sachs Research provides cutting-edge thought leadership across over 3,000 securities and over 45 economies in every major market; it was an honor to help communicate it.
Opportunity to Clarify Complexity
One of my favorite parts of creating visualizations is the chance to learn deeply about the subject and find insight along the way. It’s always exciting to turn a complex concept into a clear message and tell its story.
Evergreen Content
In addition to designing and developing interactive Scalable Vector Graphics, I partnered with the Core UX Design System team to standardize icons and create evergreen content to support future data stories and ensure consistency across production.
Kiera was a pleasure to work with. She not only created innovative data visualizations (including SVGs) for data-science-literate audiences, but also helped foster a more data-centric culture among junior analysts just starting out in coding. -M. Hinds, Goldman Sachs Analyst
Working at Goldman Sachs
I enjoyed being part of a group of thinkers that helped clients read the road ahead. Designing and developing SVG graphics while collaborating with Managing Directors in the bank's Research arm was a highly rewarding experience.