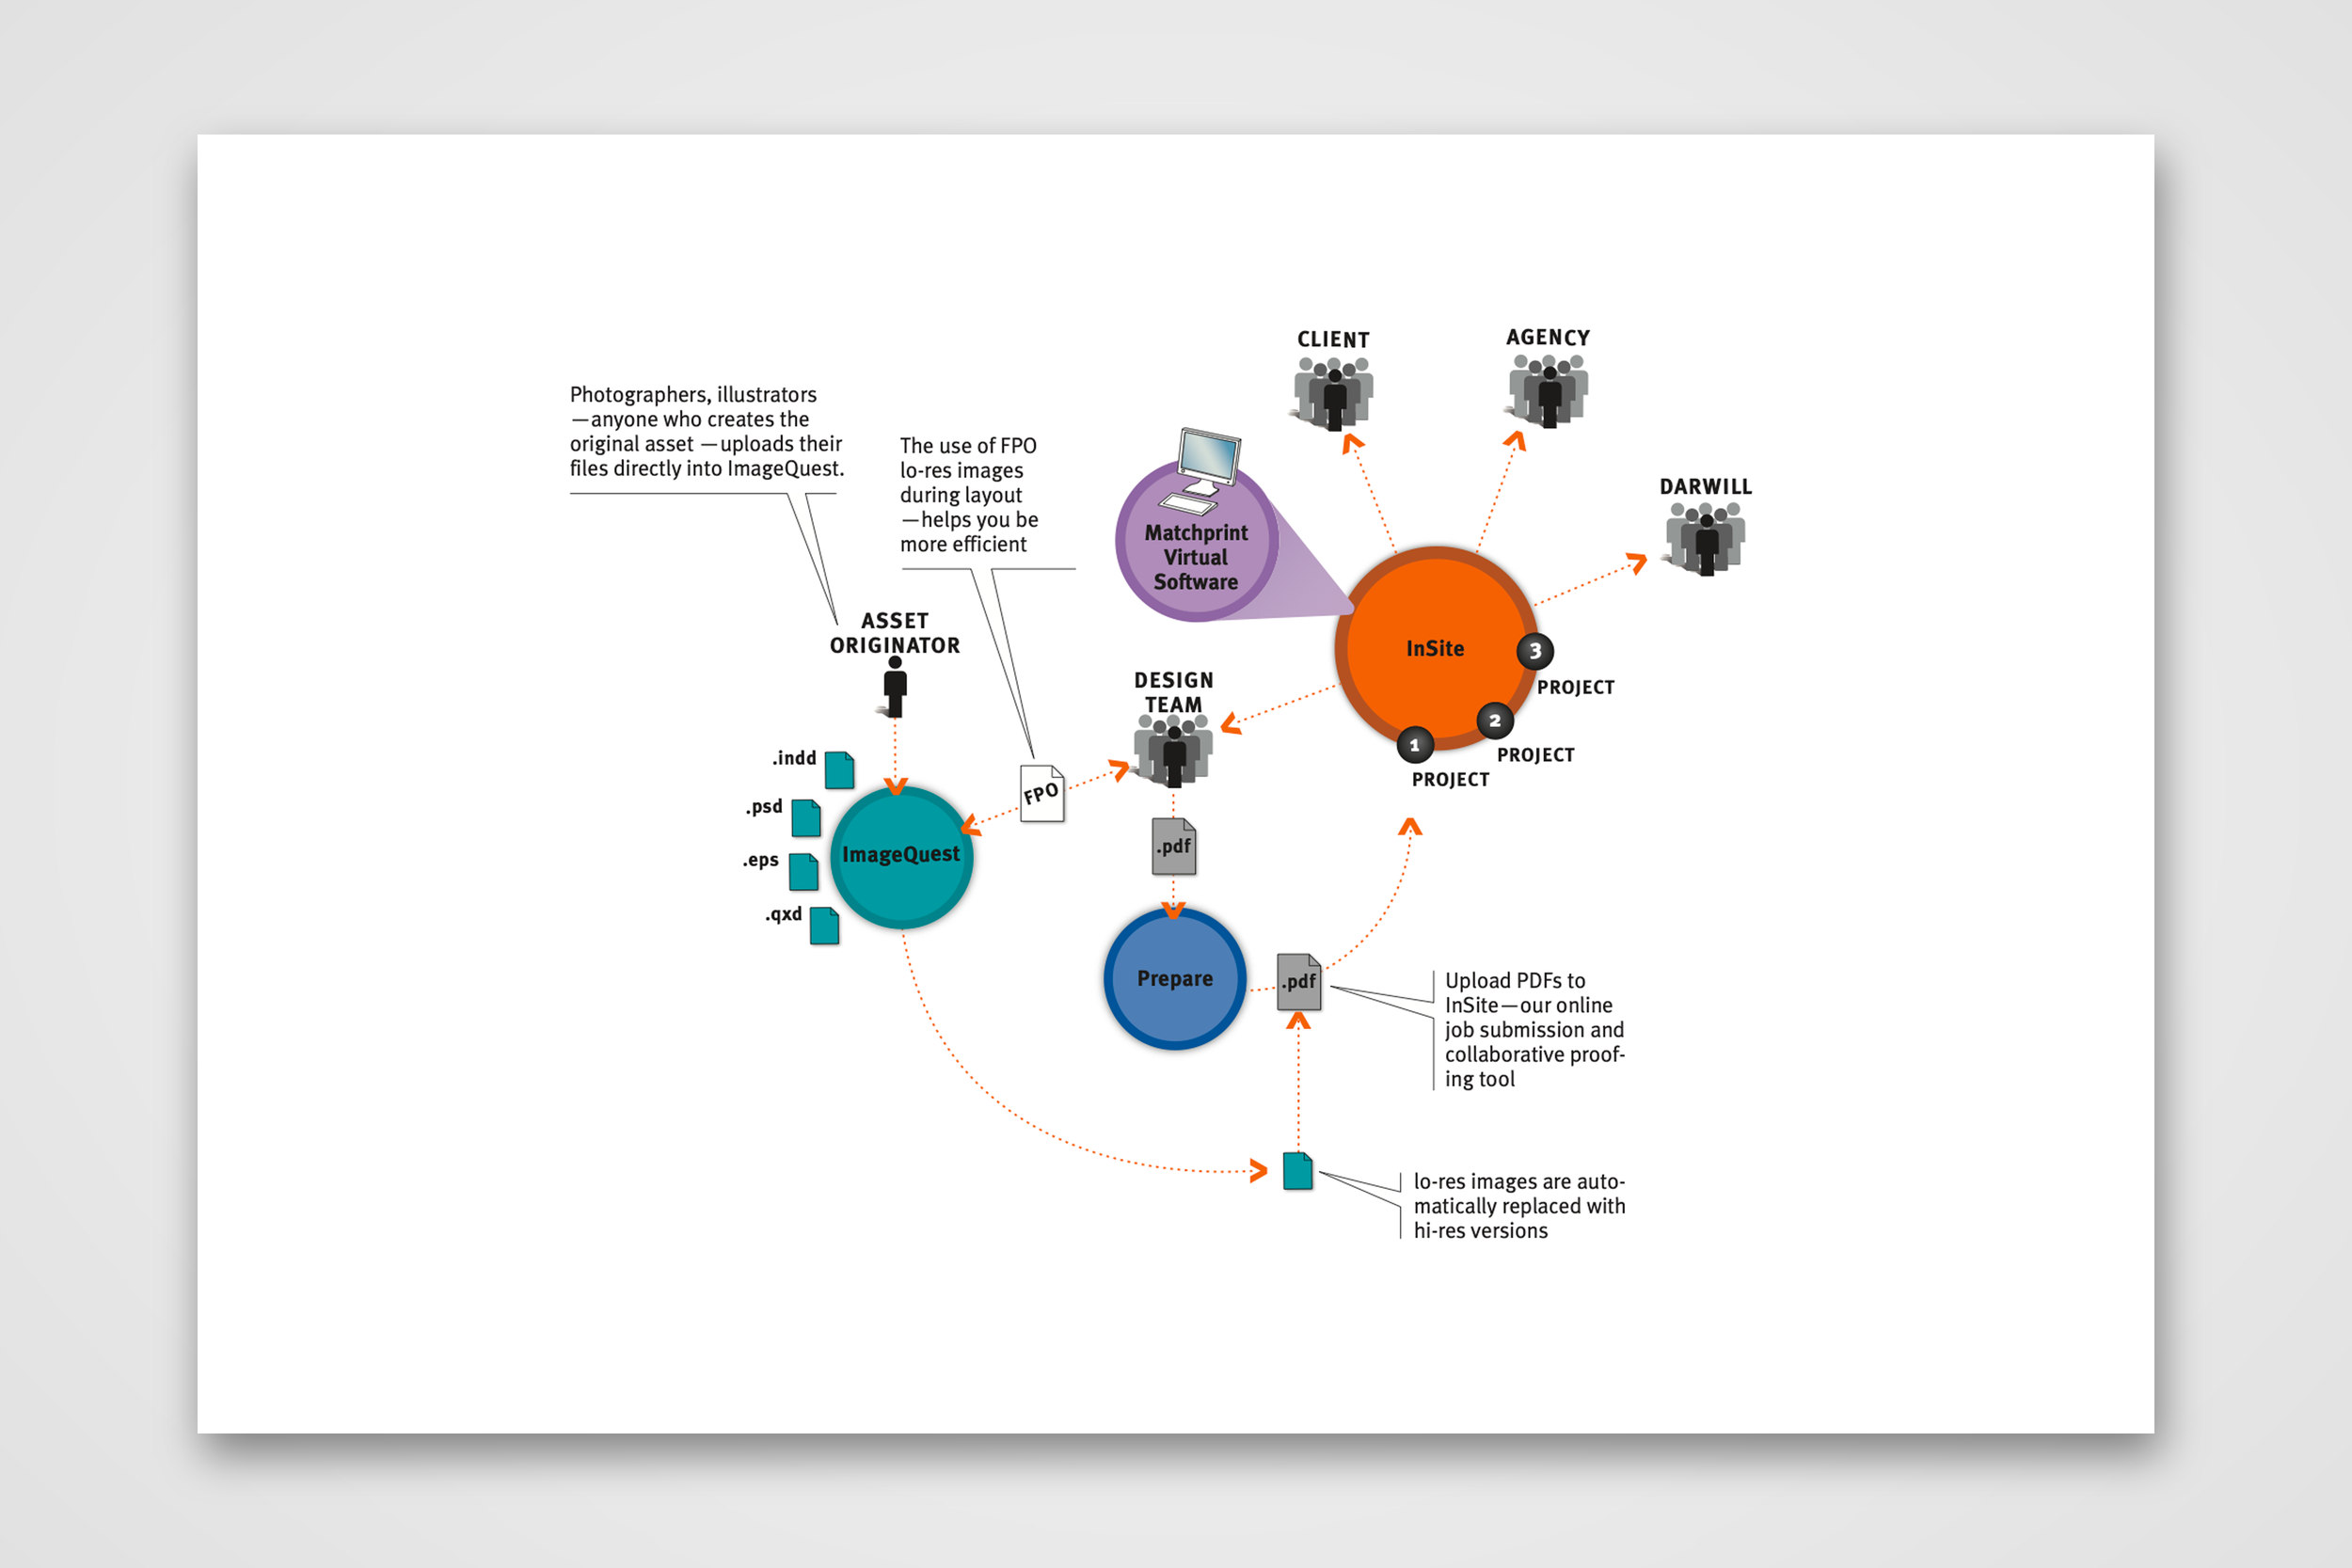
Darwill Breezeway Visual Explanation
Explaining Darwill's prepress process in six steps.
At a glance
- Company
David James Group for Darwill
2007
- Role
Information Graphics Designer
- Team
I worked directly with the creative director.
- Responsibilities
I worked on visual and concept design while the creative director provided content to me.
- Goal
Clarify the benefits of the Darwill process versus the old way that took too much time.
- Outcome
A six-step process infographic with 3D rendering, and two diagrams for a brochure that visually explained business processes.
Darwill, a commercial printer, had automated its prepress process and called it BreezeWay. For a brochure, the David James Group approached me to create a diagram explaining how BreezeWay works and why it is better than the traditional way. Create a diagram explaining Darwill's automated "BreezeWay" prepress process for a brochure.
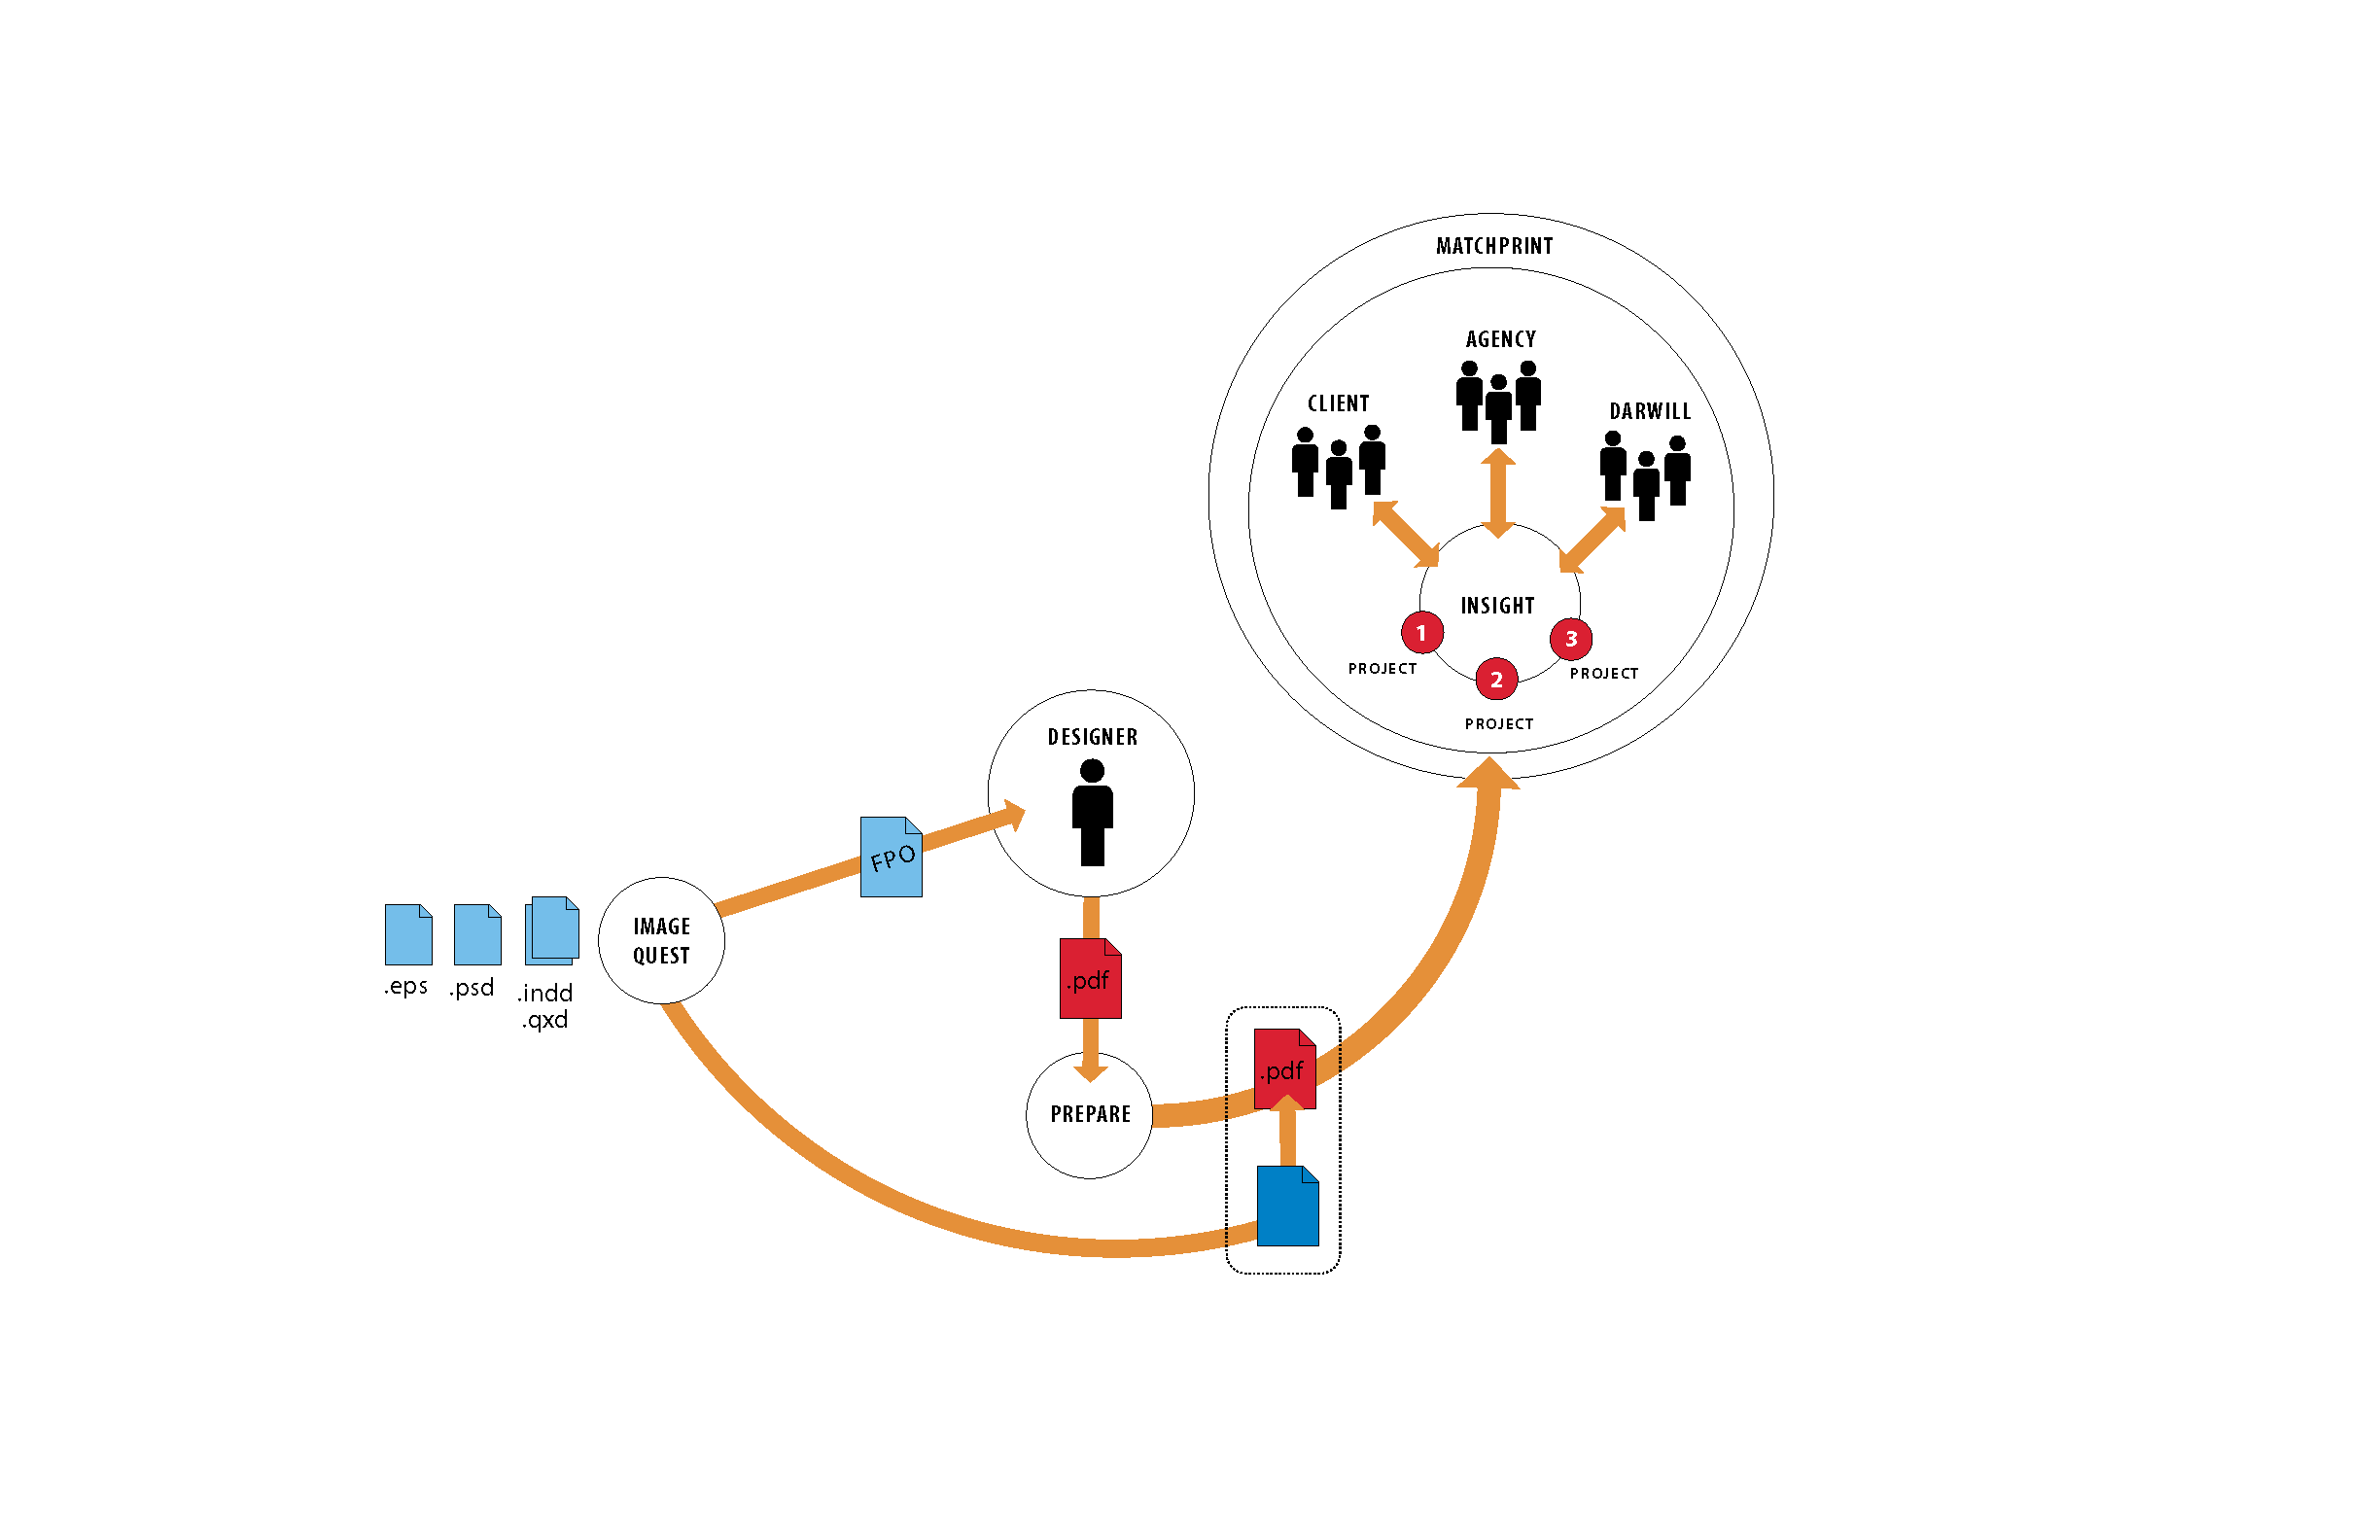
Prepress the Traditional Way
The traditional way took days or weeks; designers tracked down images, printers prepared files, and marked-up proofs went back and forth by messenger or overnight mail. BreezeWay brought those steps online, so approval took minutes or hours. I created a before-and-after information graphic for a brochure and several iterations.
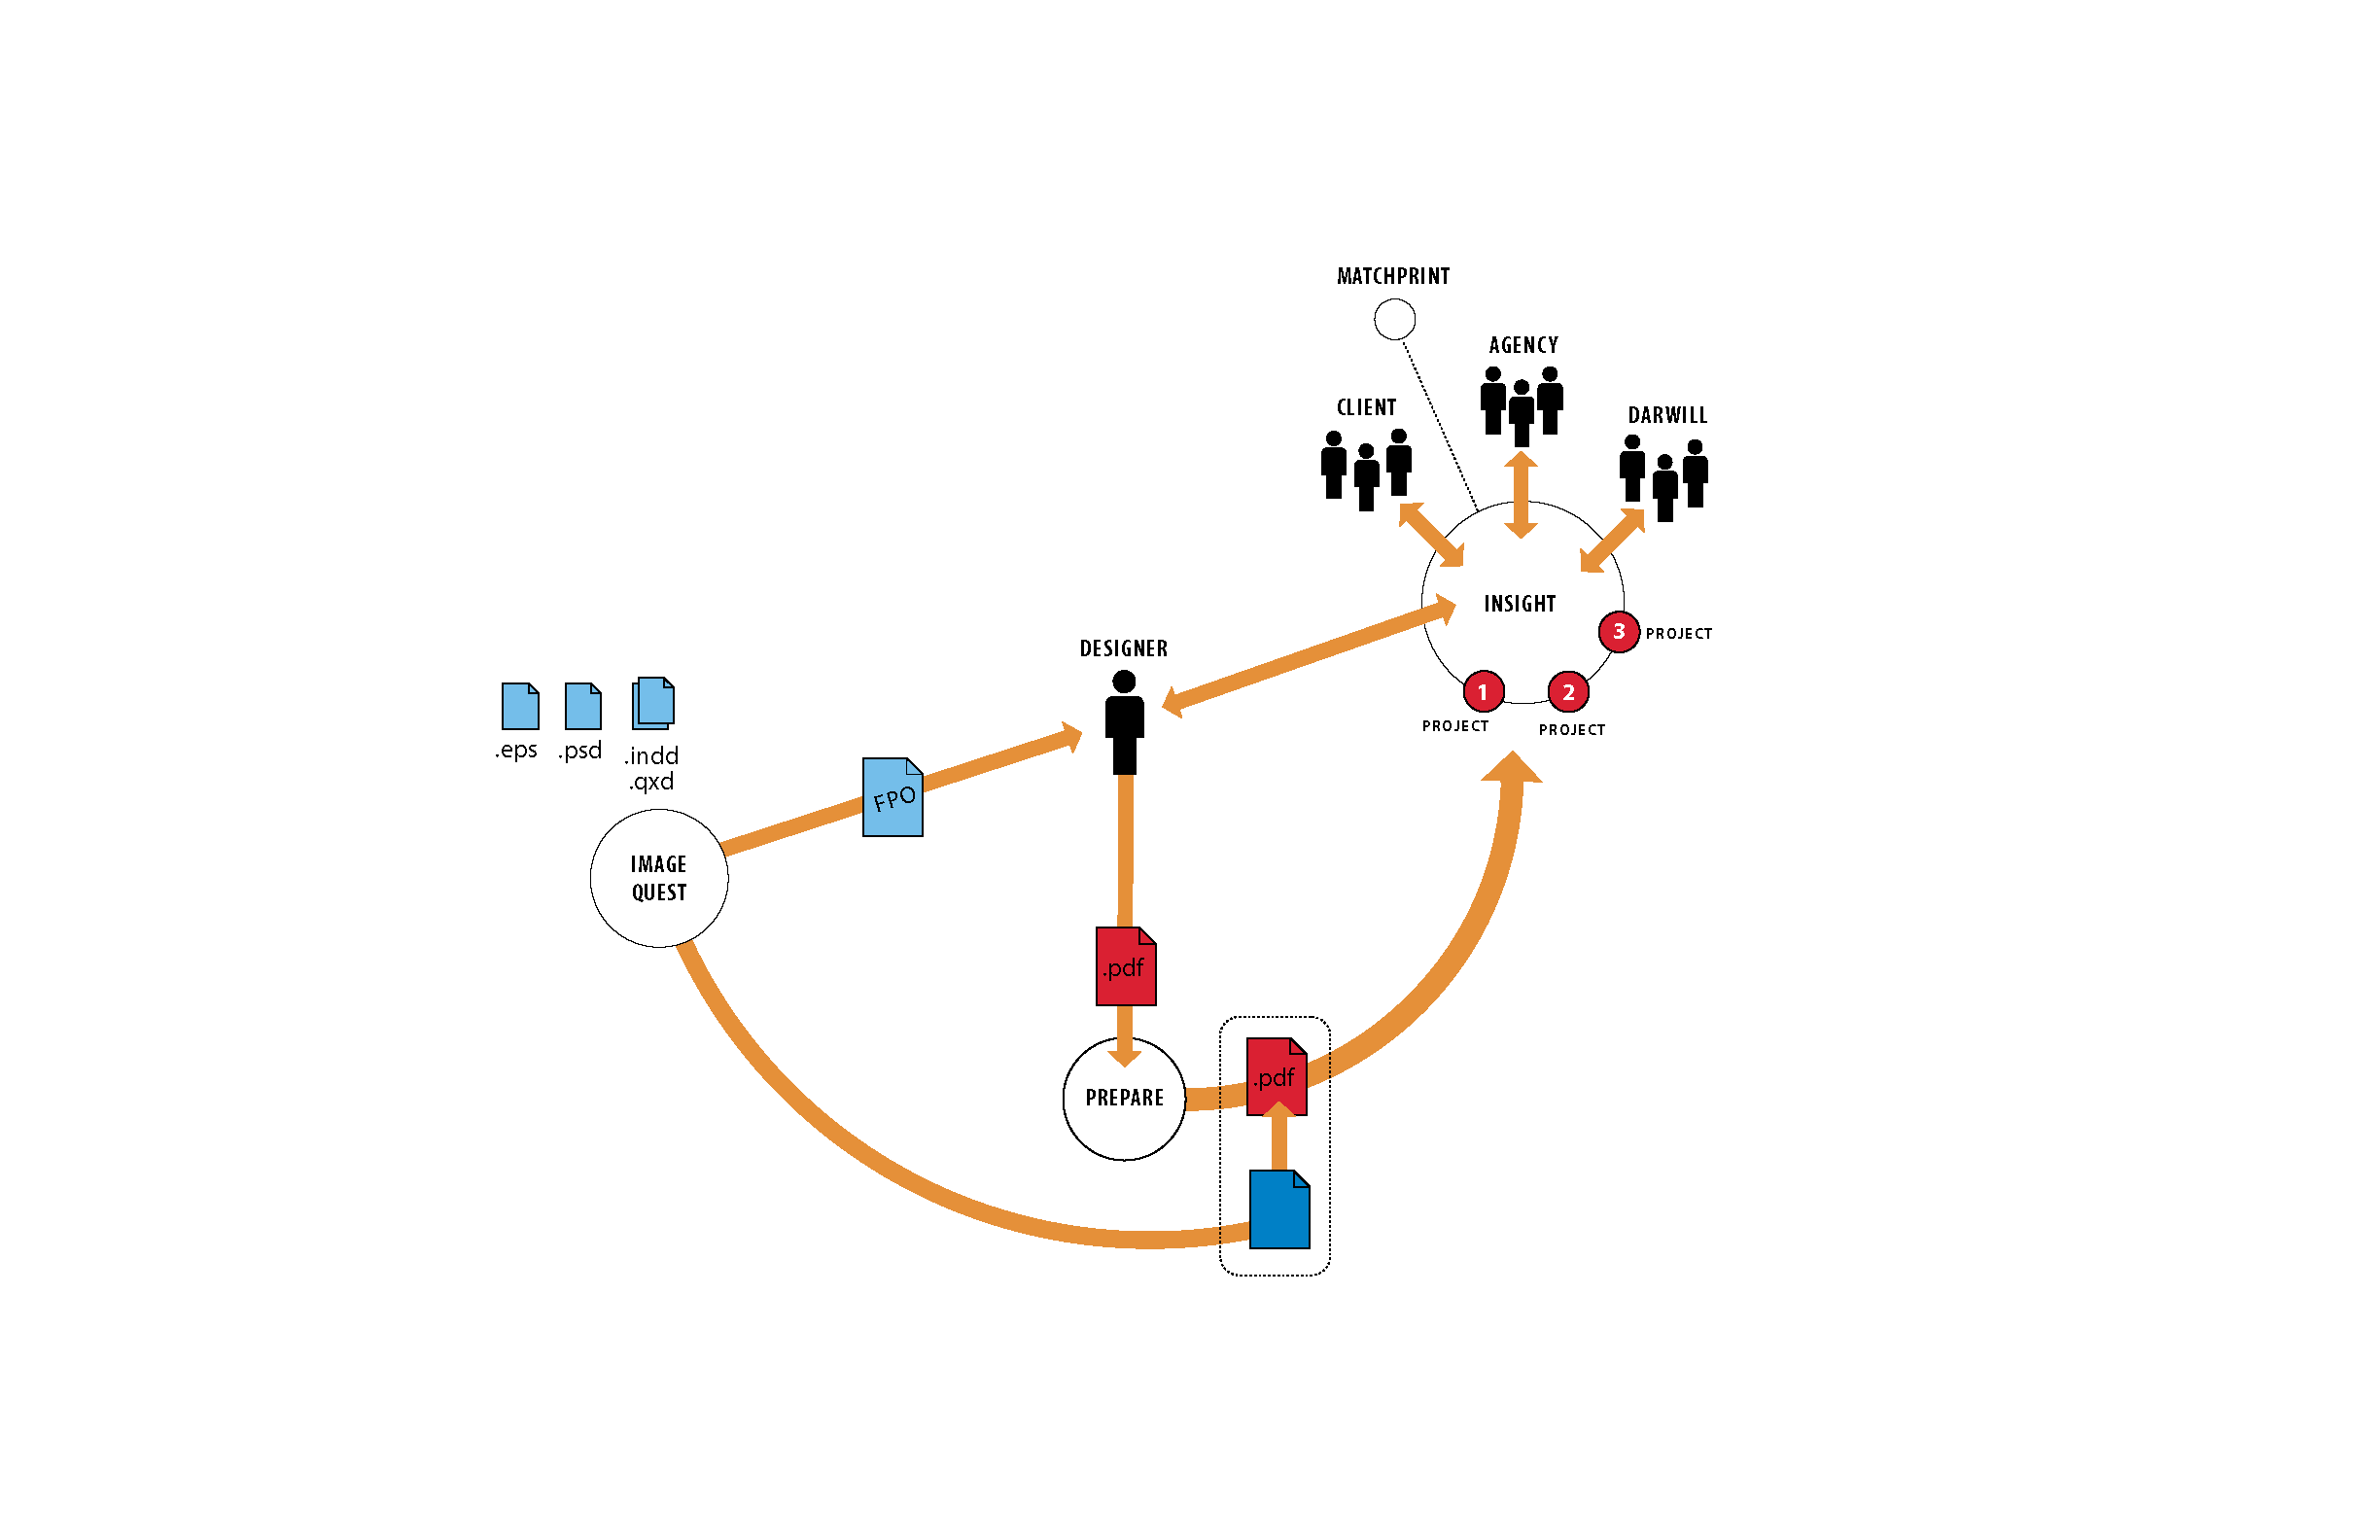
Making a complex process clear
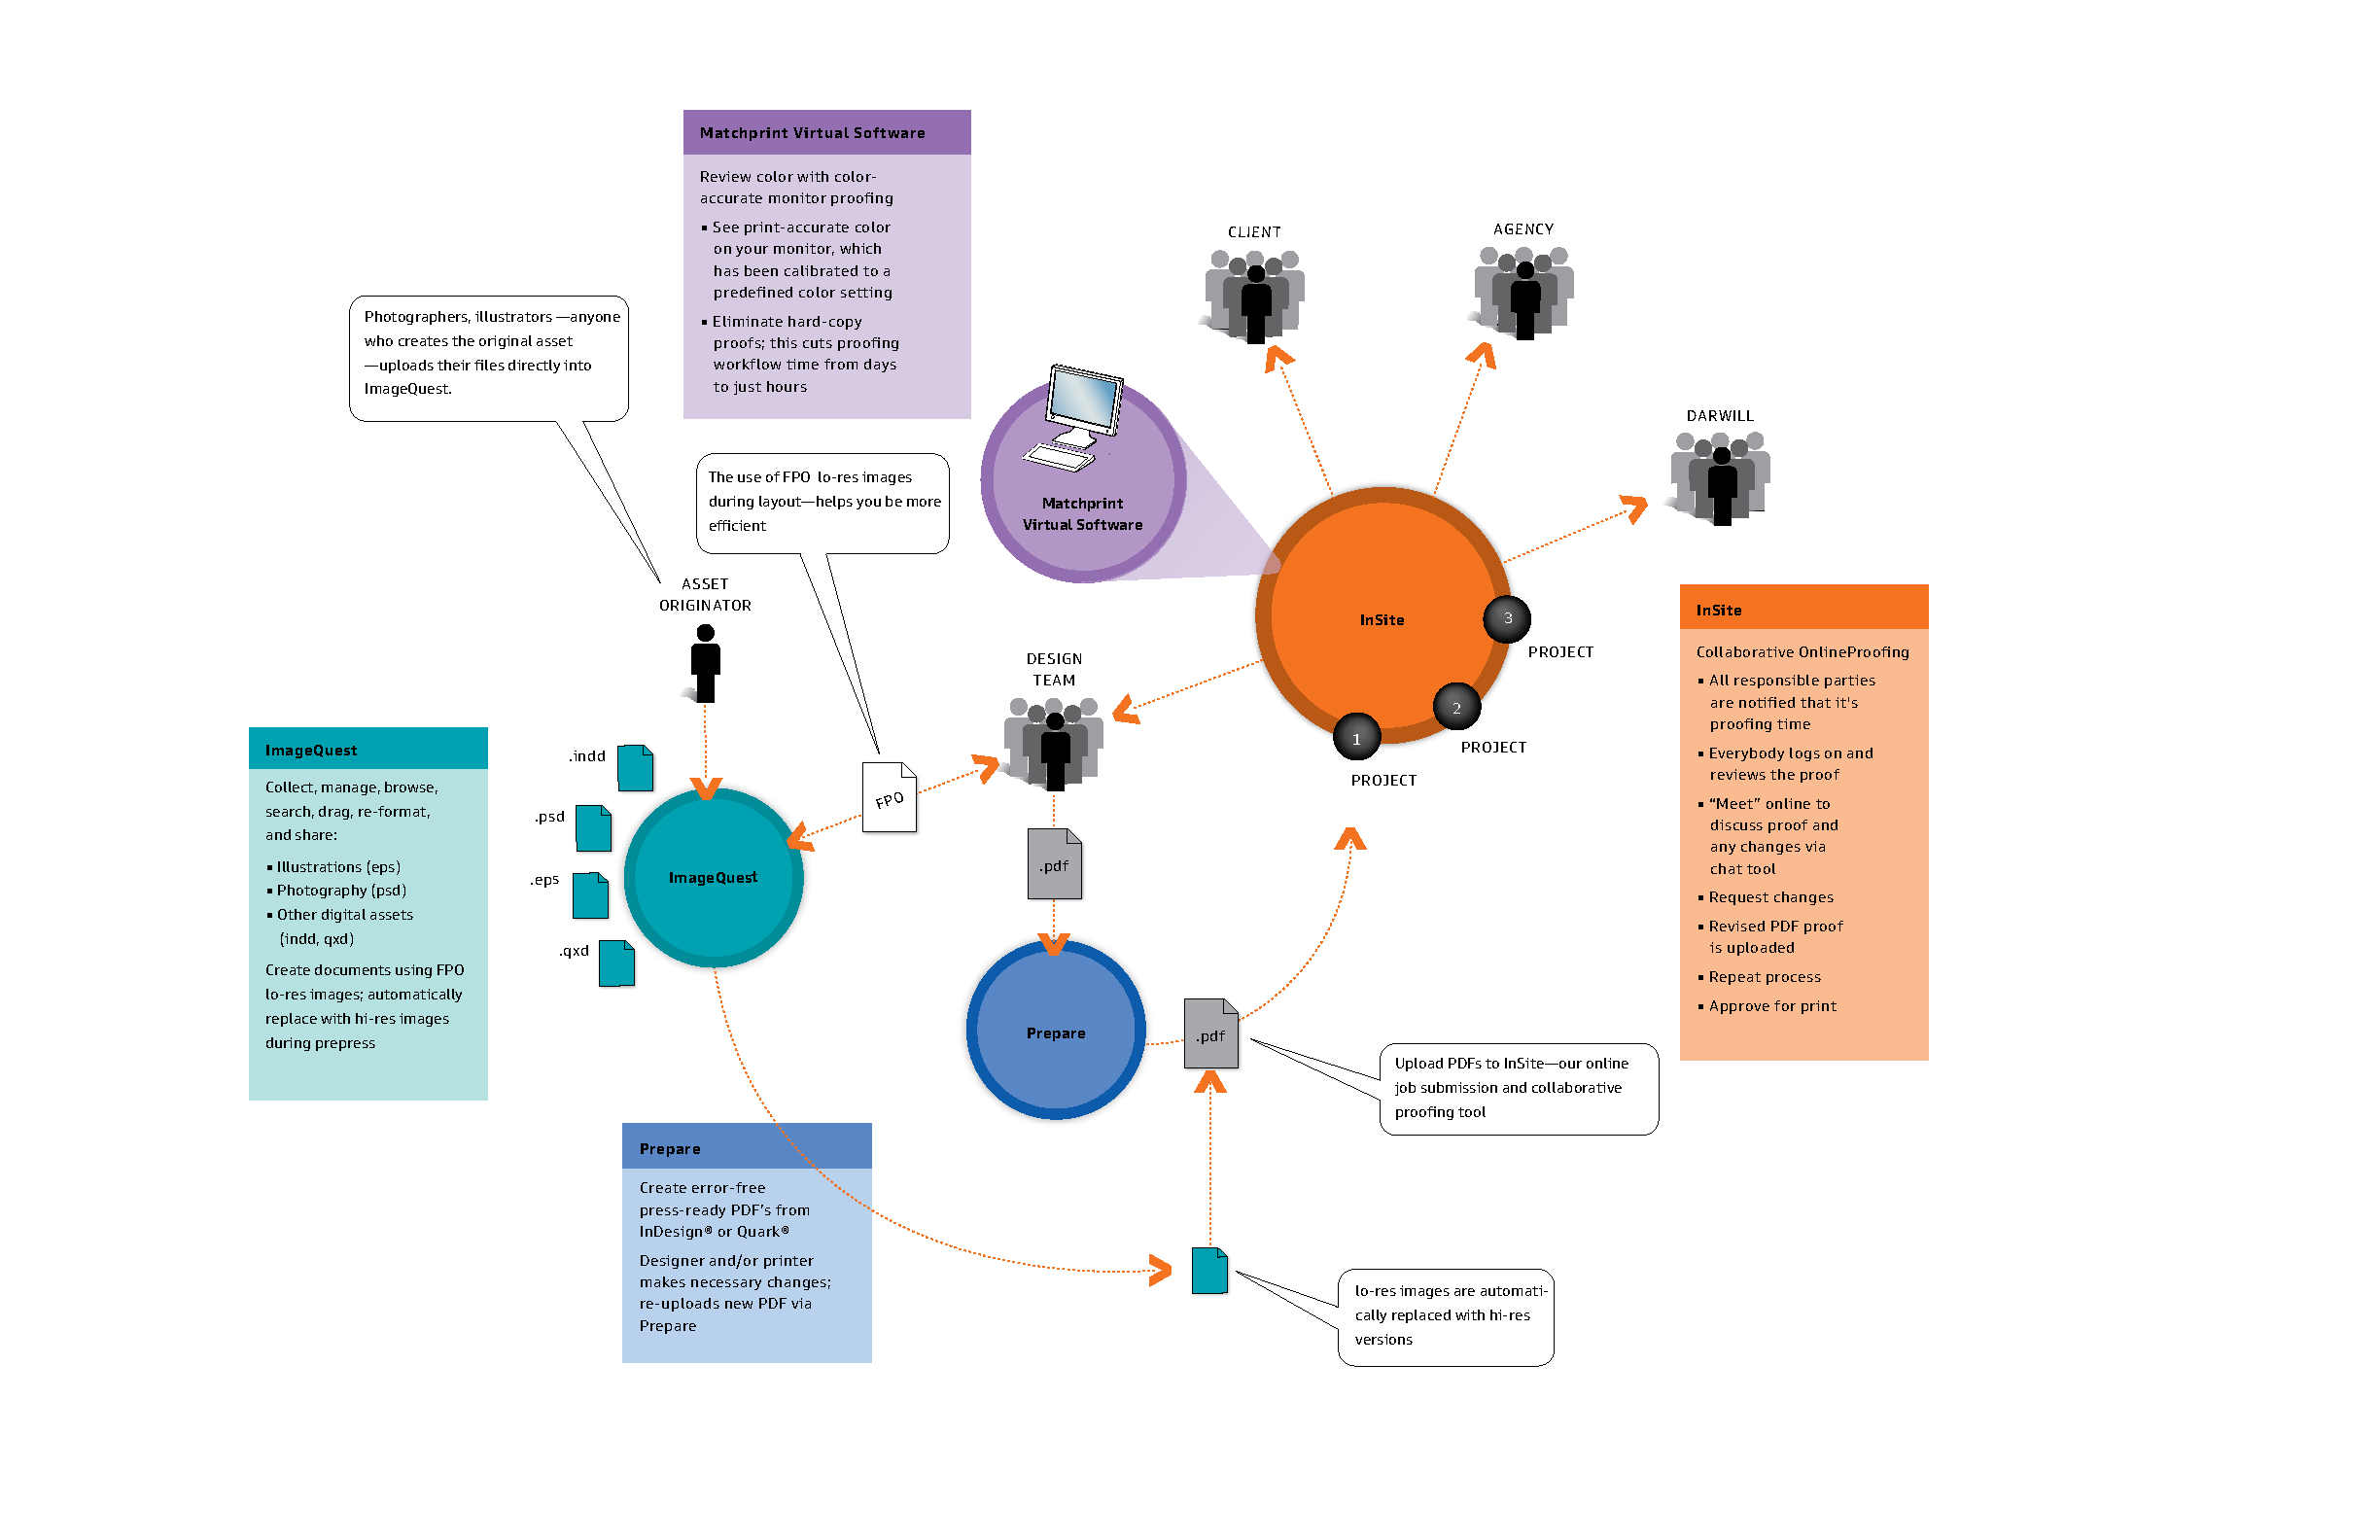
My goal was a diagram that marketers could read at a glance, showing how files move through Darwill's four tools and who is involved at each step. How might we show the time BreezeWay saves, from days and weeks to minutes and hours?
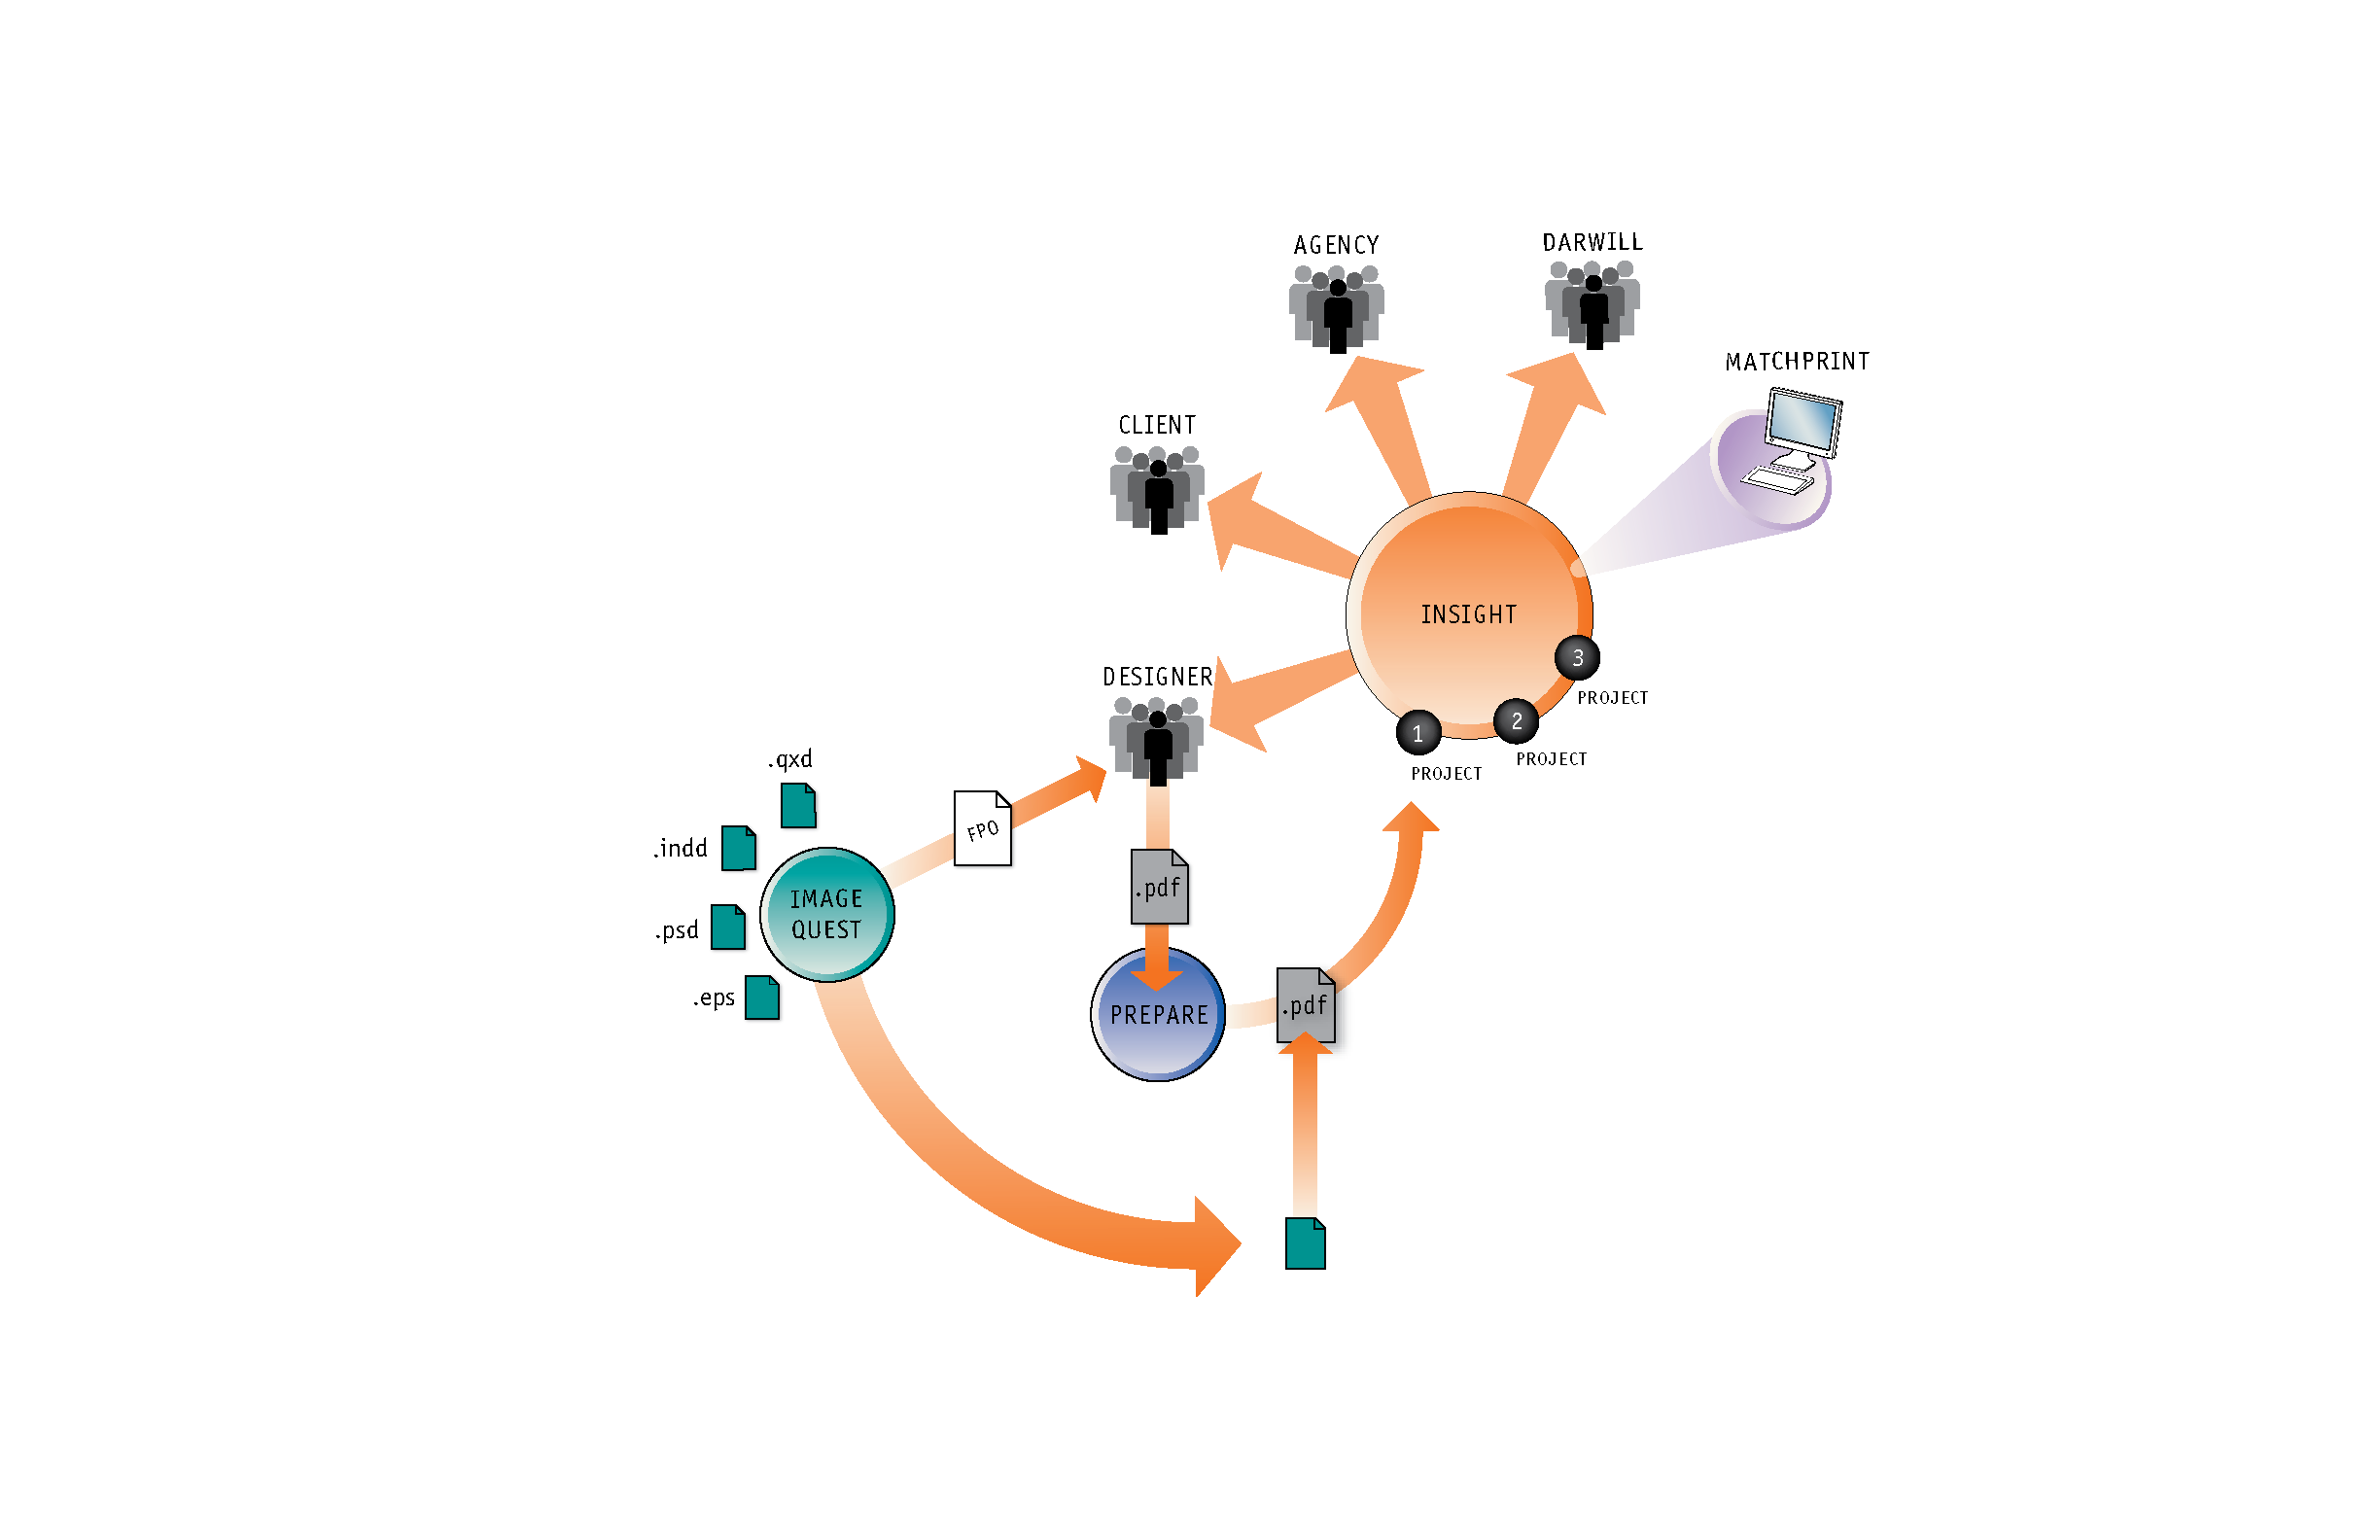
Developing the diagram in six steps
I developed the diagram over six steps. Early versions mapped the flow with line art. Later versions added 3D rendering, a color for each tool, and callouts that explain what happens at each point in the process.
Pairing the diagram with a legend
To keep the diagram uncluttered, I moved the detailed descriptions into color-coded panels, one for each tool. Each panel uses the same color as its circle in the diagram, so readers can move between the two easily.
Infographics to Explain a Process
After my time at the Chicago Tribune as a visual journalist, I began creating infographic illustrations that explained complex projects in a simple, clear way. Building on this skill, I developed a consultancy that involved listening closely and iterating with clients to bring graphics to life.