Visual Journalist
Built explanatory visualizations daily and early interactive graphics in Flash, connecting the print paper and the ChicagoTribune.com.
At a glance
- Company
Chicago Tribune Graphics
2004-2007
- Role
Visual Journalist, Flash Animation
- Team
Reporters, visualization artists, illustrators, page designers, and editors.
- Responsibilities
Daily, I created visual stories for the printed paper and digital visual explanations for in-depth reporting on ChicagoTribune.com.
- Goal
Create visual explanations of daily news, with occasional investigative journalism stories.
- Outcome
Created daily graphics for news stories and led the transition to interactive graphics on ChicagoTribune.com.
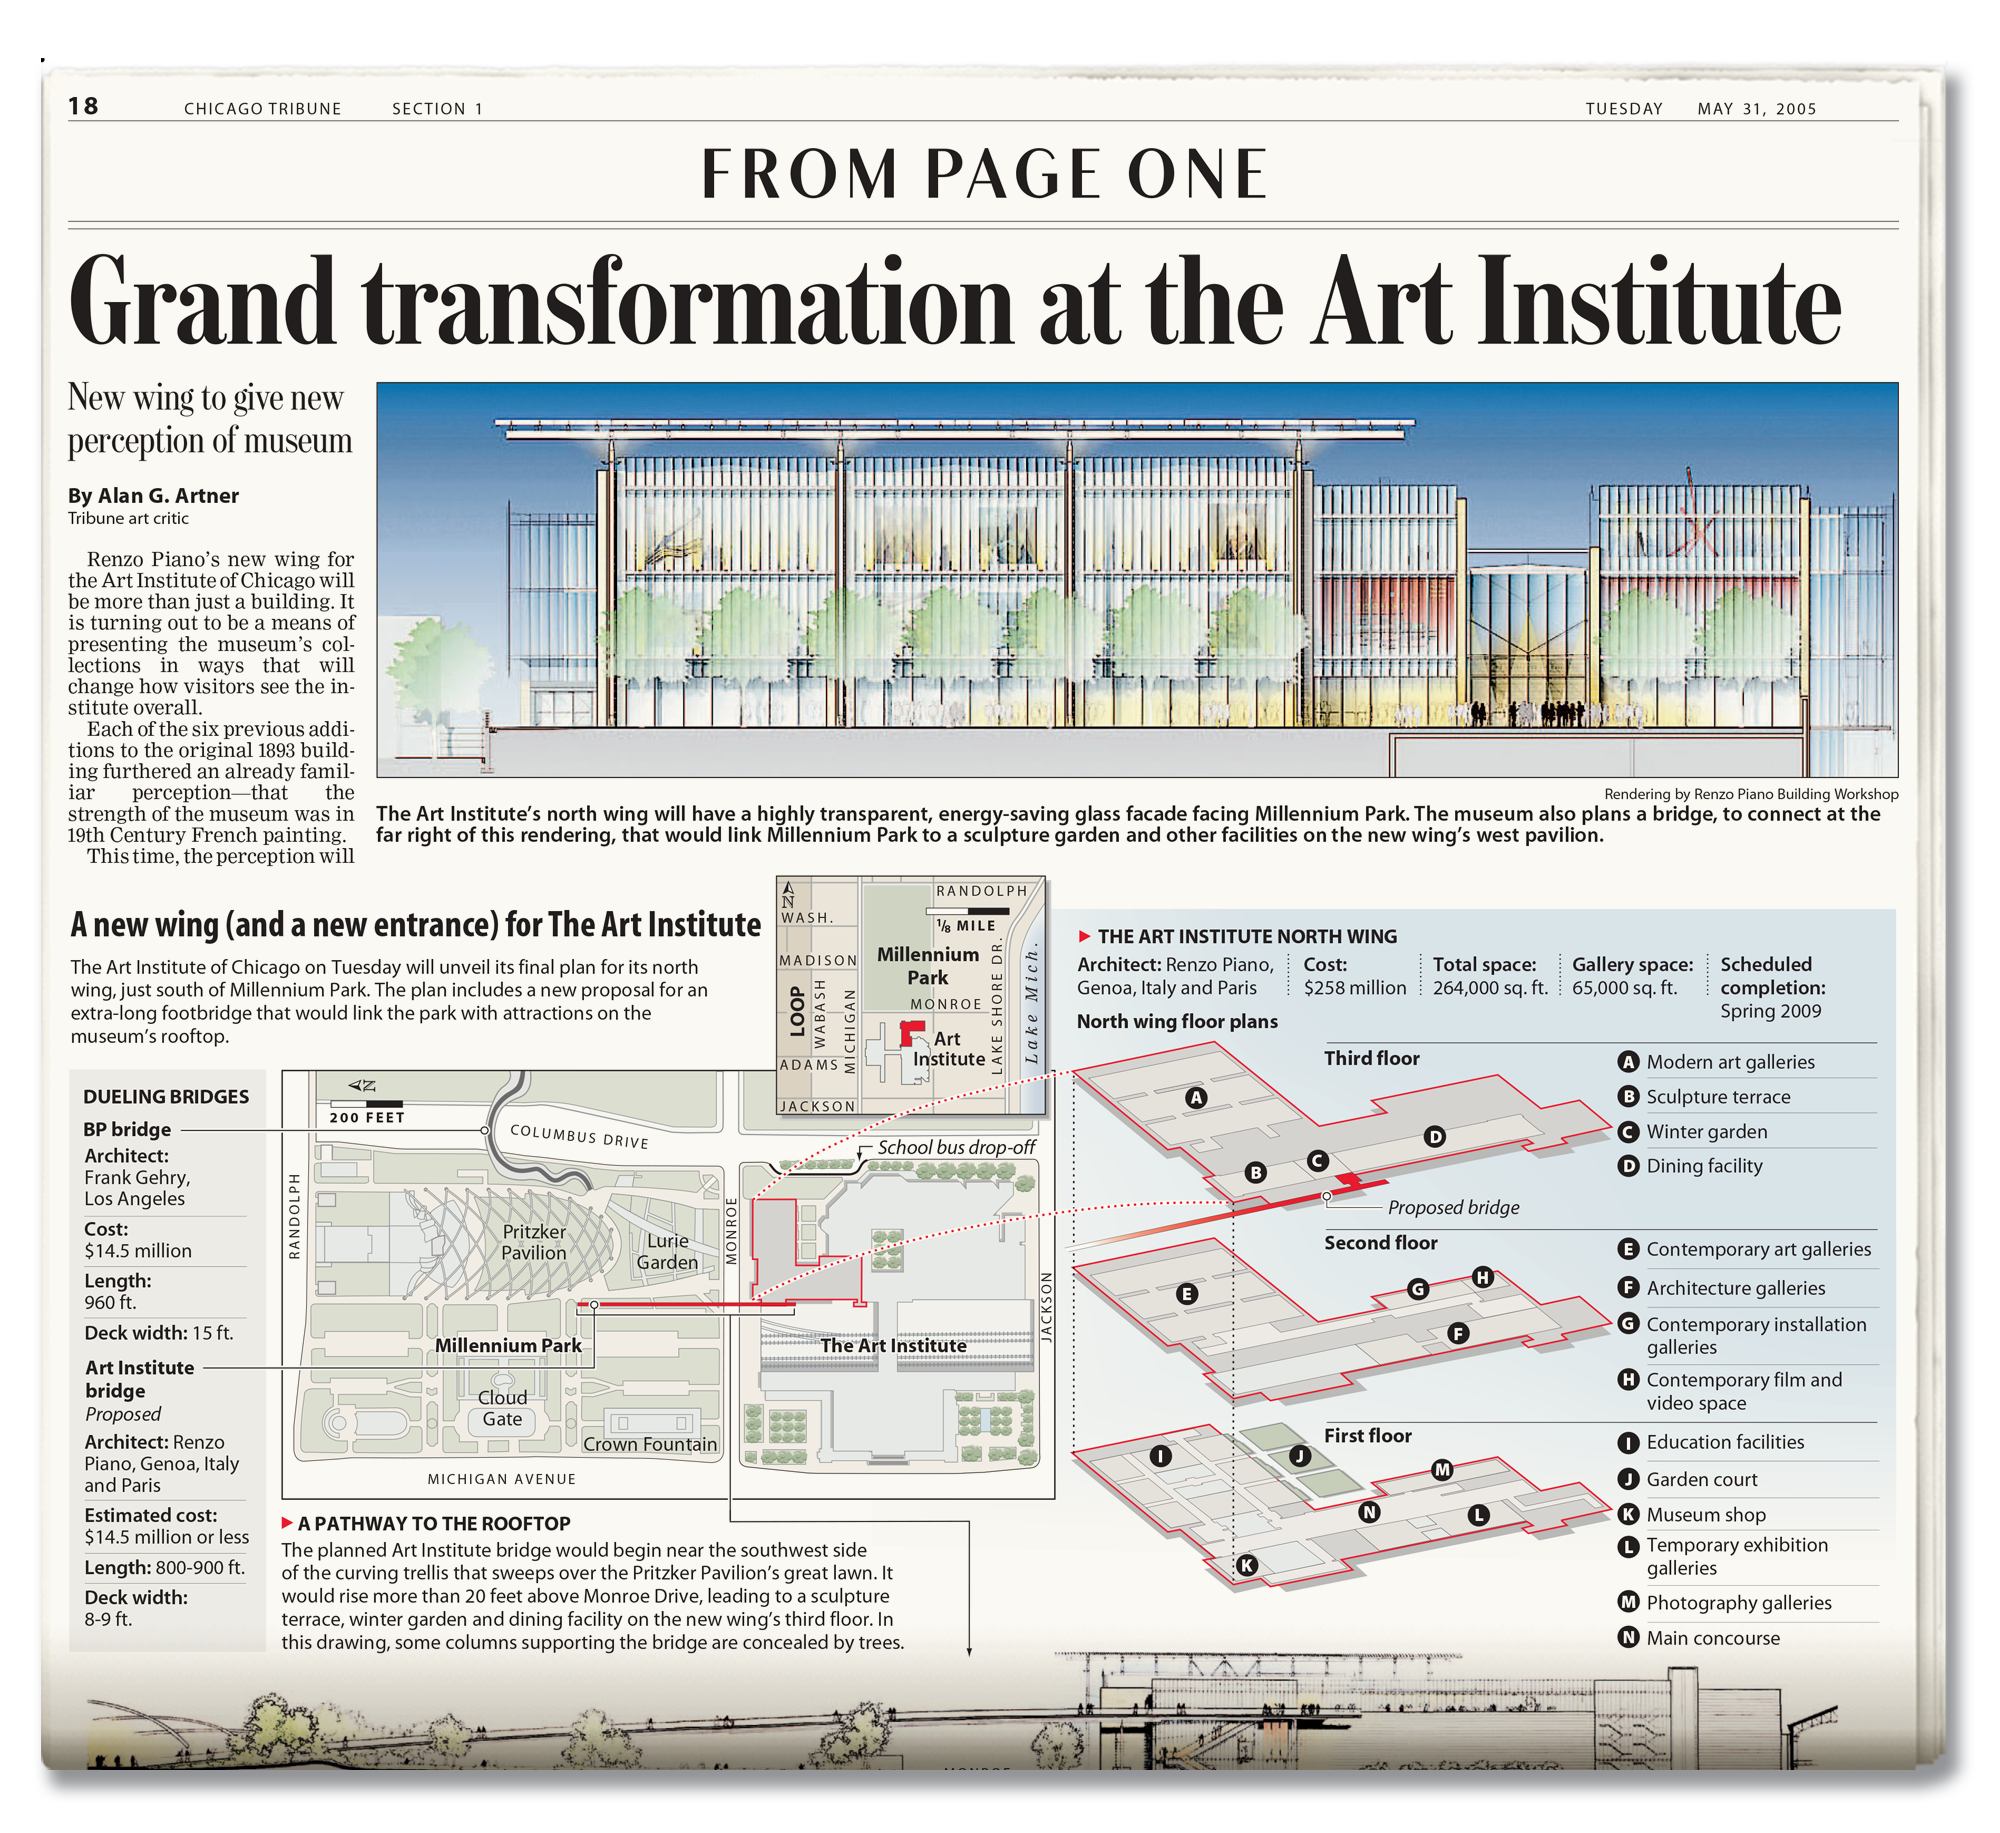
To be part of a great newspaper like the Chicago Tribune was an exciting journey and an honor to work in an iconic building just below its famous buttresses. Highlights of my experience included daily print infographics describing the Art Institute expansion and creating some of the first interactive graphics on the web.
Context
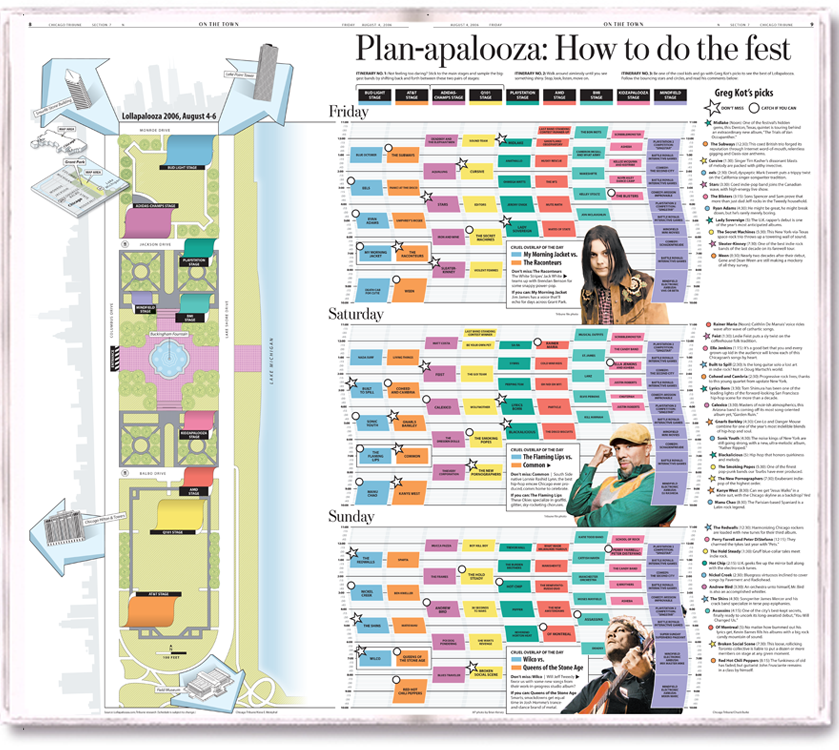
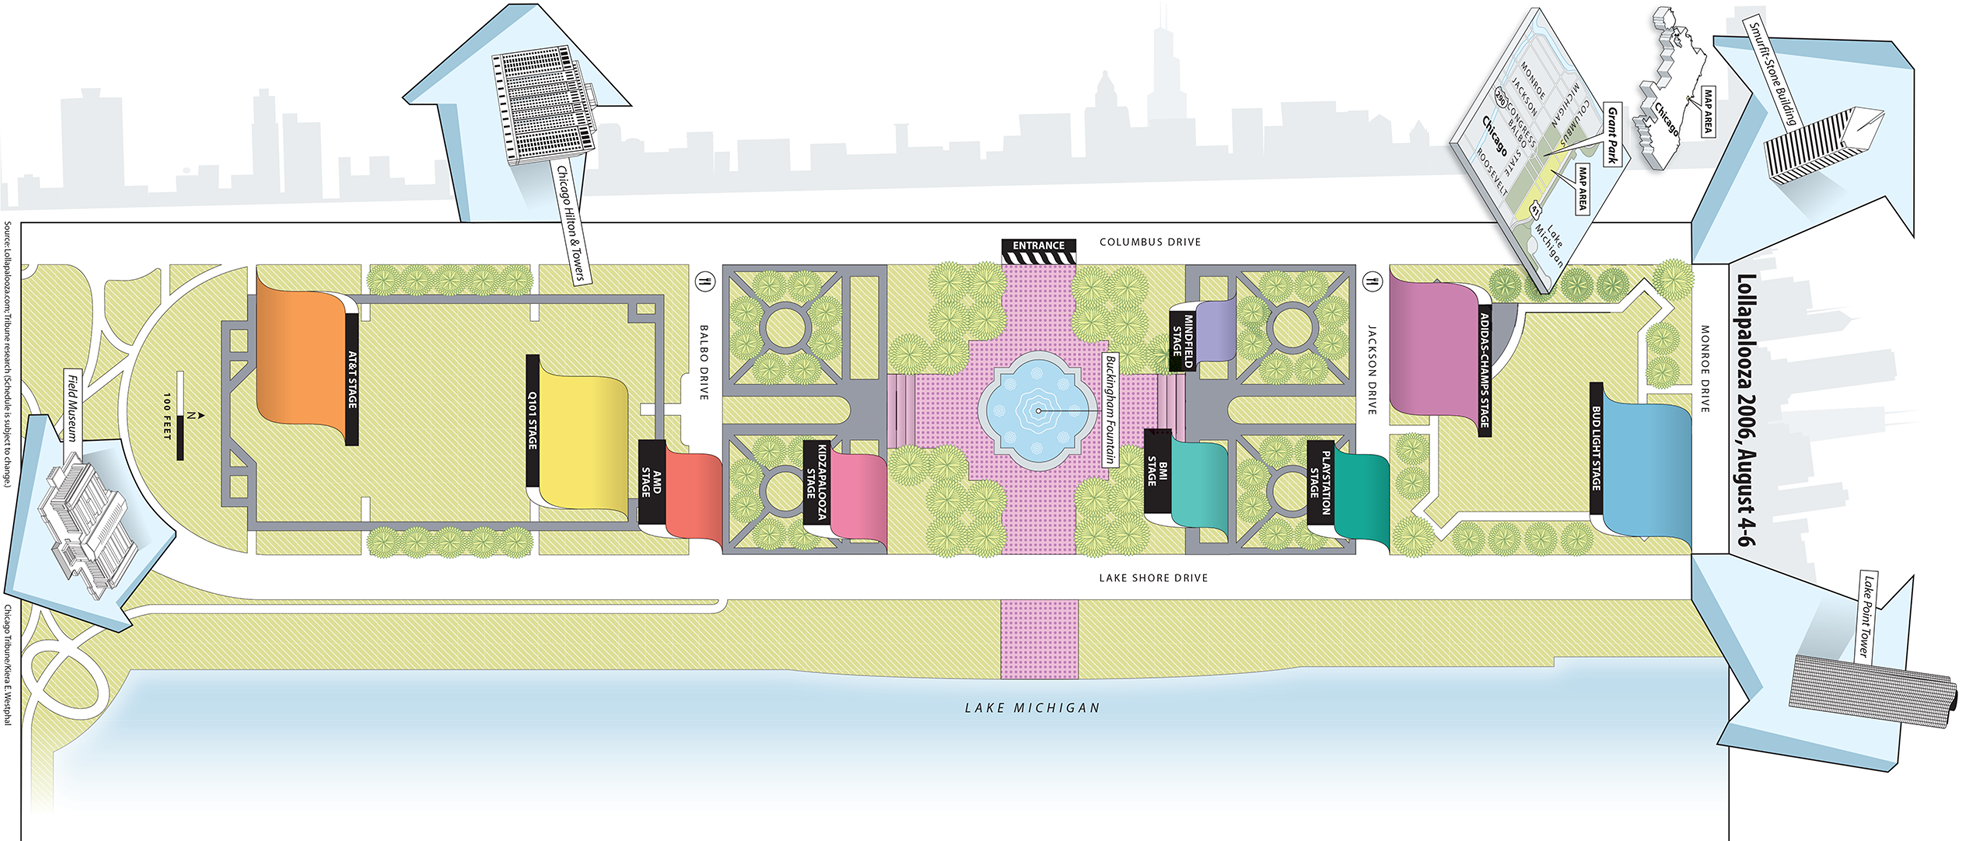
Every day at the Chicago Tribune was a new adventure. Depending on the news that day, I worked on 2-3 small visualizations or, if a breaking news story broke, I worked with other artists to contribute to a larger data story that took up an entire page. At times, I worked on a page-one story, designing and illustrating a visualization while editors watched me work. No matter the situation that day, I was thrilled to contribute to the team and run with the news.
My goal
Visual journalism instilled ethical practices of accuracy and working with an established design system, all at a rapid pace. Knowing my work would be seen daily by 500,000 subscribers instilled a discipline I've held onto throughout my career.
Design principles and frameworks
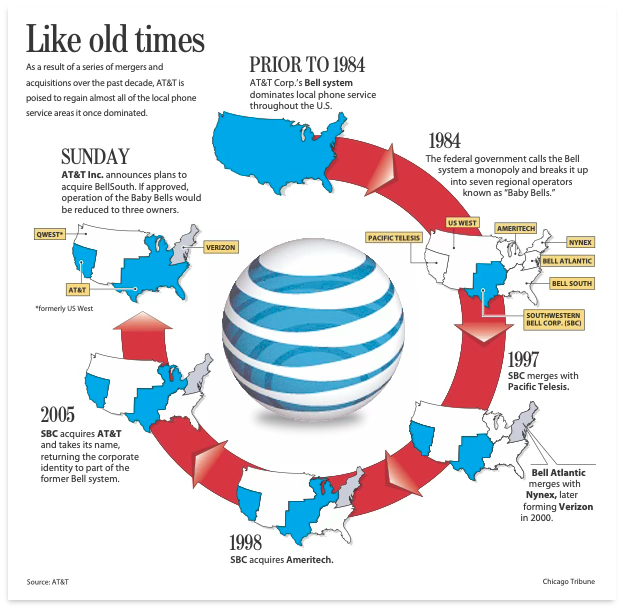
One of my favorite things about working in the newspaper business is the number of eyes on my work. When a graphic was ready for print, it traveled the newsroom and went through several checks and balances to ensure accuracy.
Challenges
As a visual journalist, the day begins at noon and ends once the paper is sent to print. The paper is unique in that it has an omnipresent, ongoing momentum. I enjoyed the rhythm. It is a constant cycle of feedback and collaboration, which makes the work great. I quickly learned my limits so I could meet deadlines. Unfortunately, that meant that sometimes an idea could be great, but time constraints required a simpler solution.
Transition from print to digital
Eager to bring visual journalism to the digital realm, I learned Flash and began producing feature stories and investigative journalism for ChicagoTribune.com
Breaking news
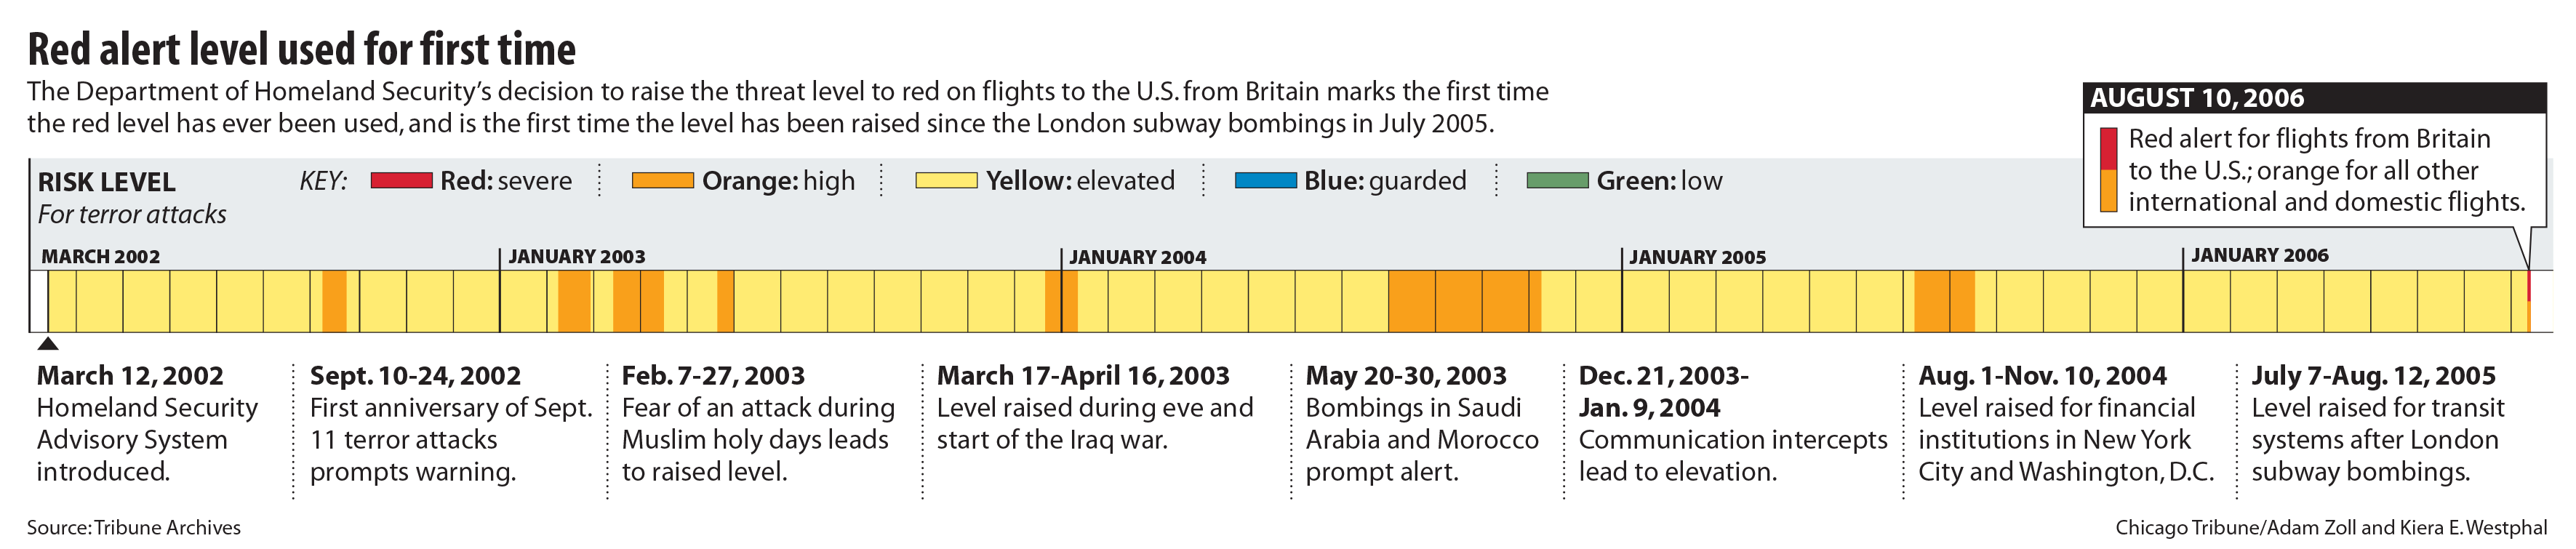
One of the best feelings was being pulled into a breaking-news story and surrounded by the paper's best minds.
Working at the Chicago Tribune
I loved working at a large news organization. Not only was I surrounded by a brilliant visualization team, but it was also an honor to speak with critics and writers daily.