information visualization
Goldman Sachs' Global Investment Research turned complex data into engaging, interactive stories on the Research Portal. Featuring visuals, real-time data, and customizable insights, the portal made market trends, forecasts, and sector analyses more accessible and actionable for clients and analysts, enhancing their research experience and reflecting the firm's commitment to insightful investment research.
individually crafted and developed
As the sole designer on my team with development experience in Scalable Vector Graphics, I met with analysts to design the concept, then individually crafted the experiences. These typically took 1-2 weeks to meet with the Analyst reporting the story, sketch ideas, iterate, and release the SVG to the Global Investment Research Portal.
This interactive graphic categorizes online streaming services by genre, content, and subscription type, highlighting the complexity consumers face. It helps users understand options and make informed choices.
background
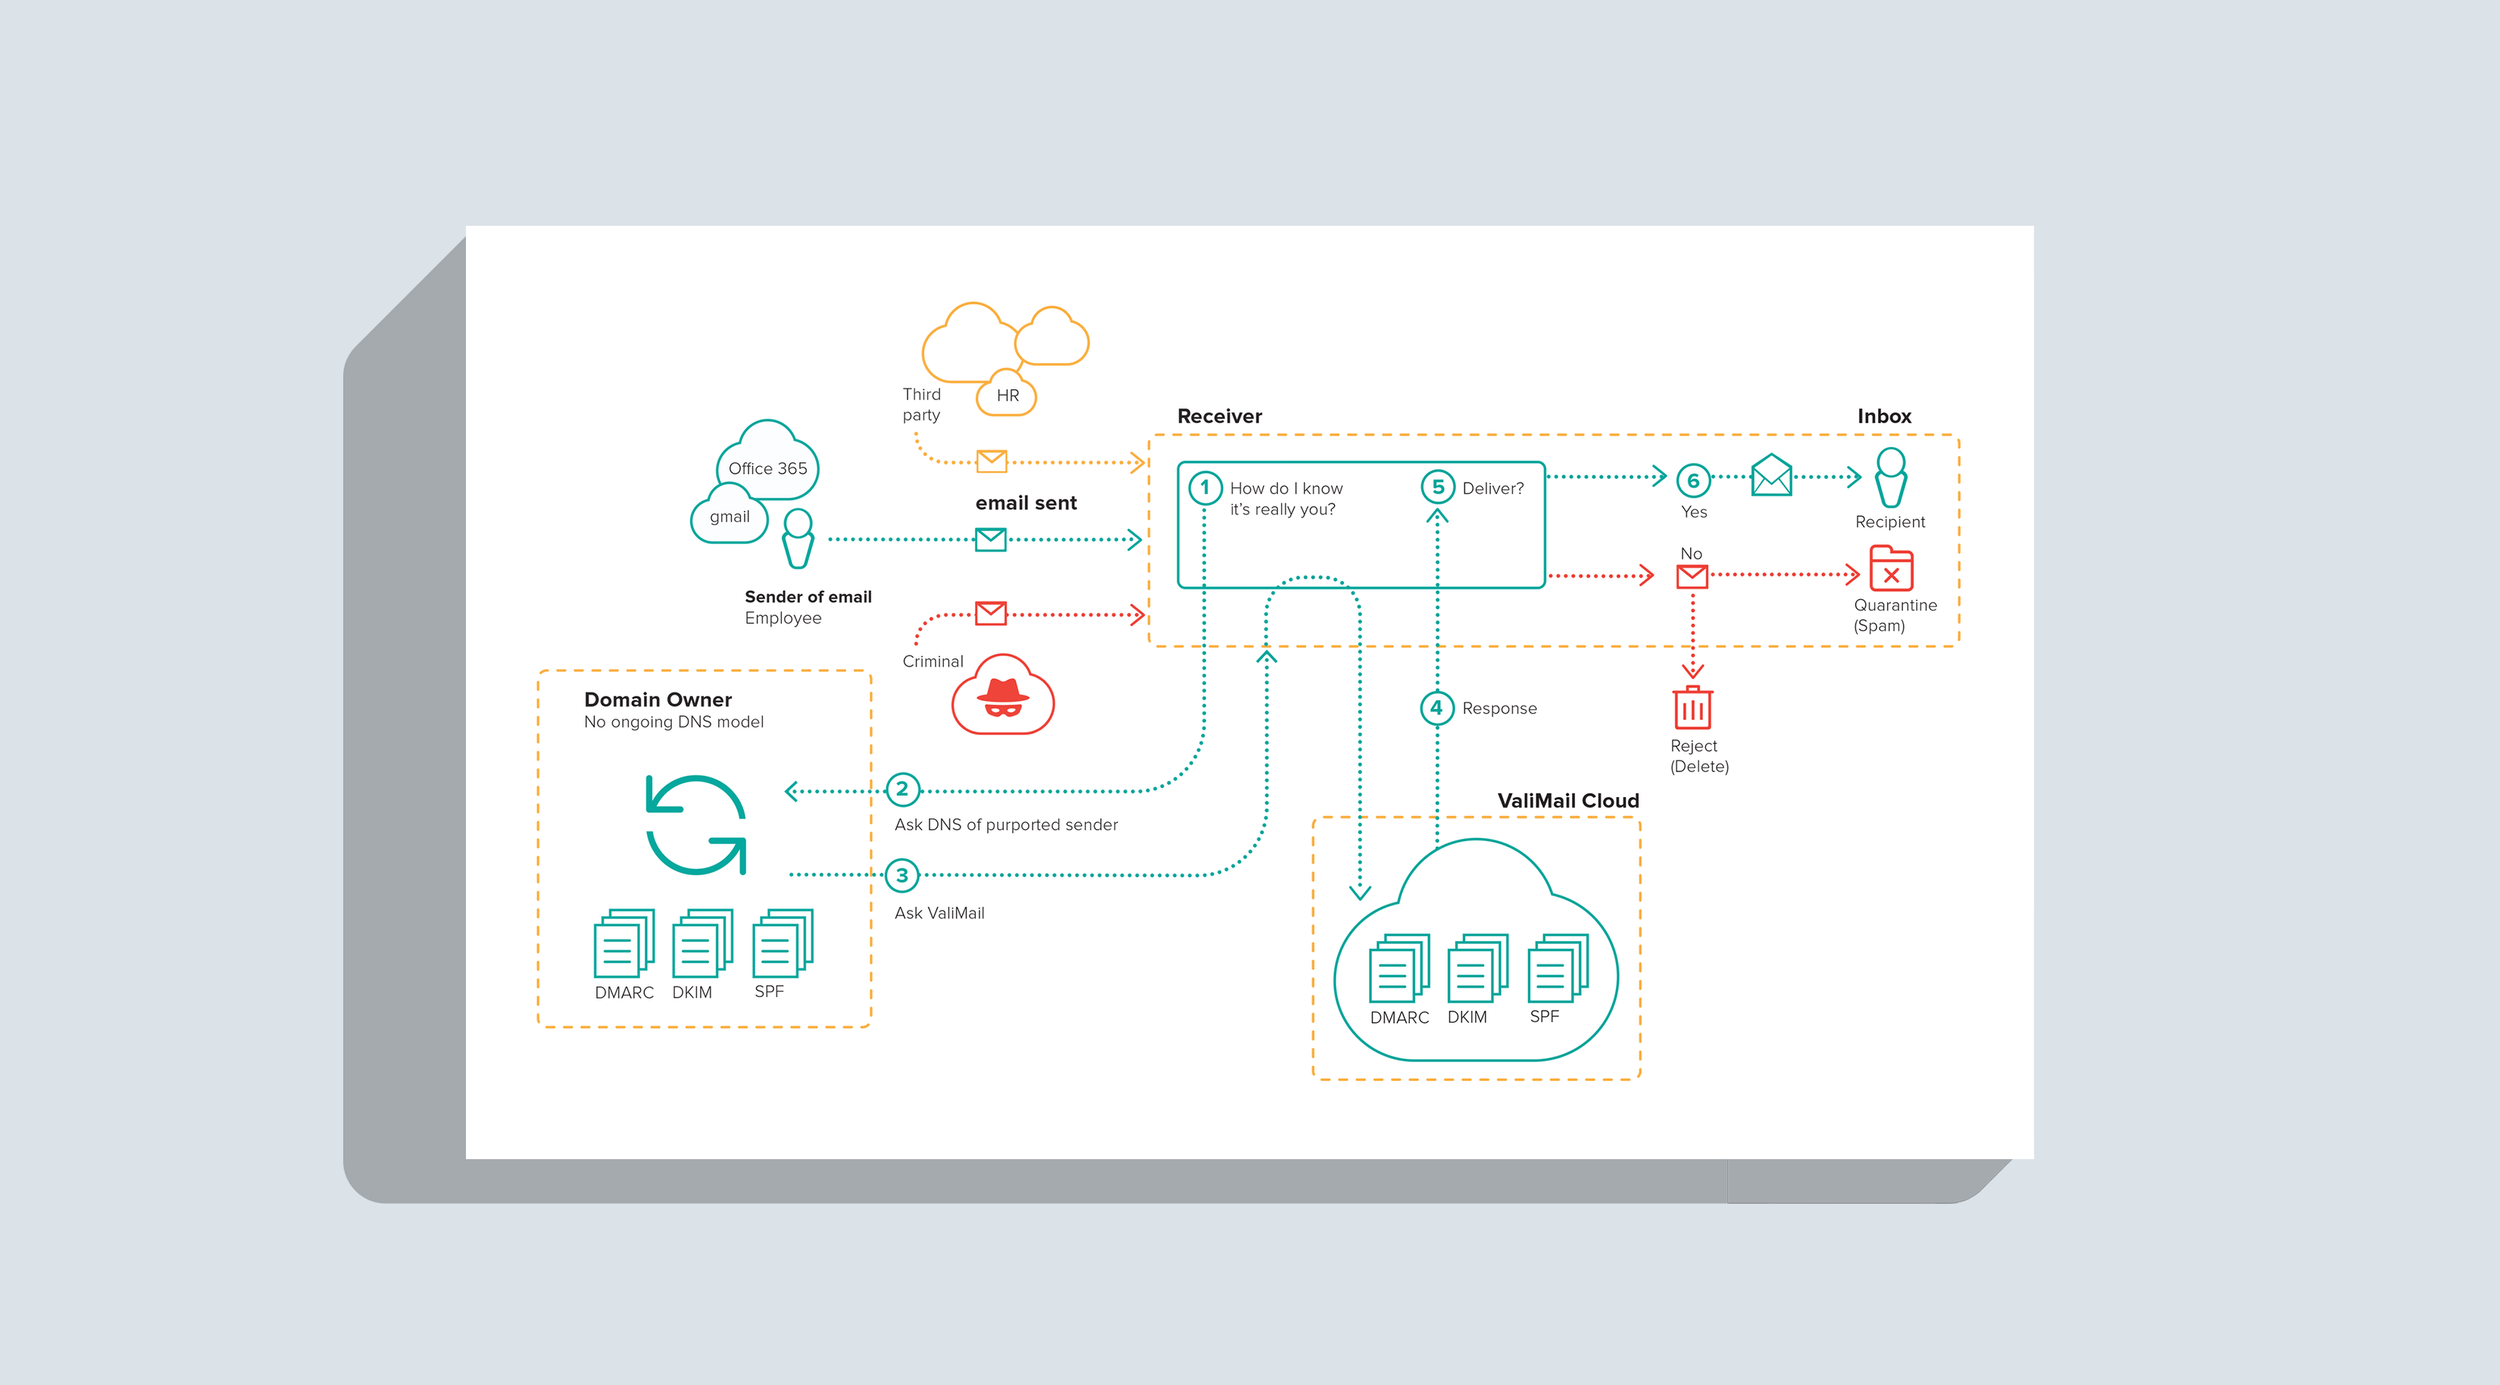
As a product designer, I specialize in simplifying complex ideas to make them more accessible and understandable. Visual explanations effectively communicate concepts to stakeholders and design partners. This collection includes graphics for the Chicago Tribune, where I began my professional career.


